
In this guide
Food cost percentage is the cost of the food you actually consumed in a period divided by your food sales (net of GST) for the same period, written as a percentage. In practice you take opening stock, add purchases, subtract closing stock to get consumption, then divide by net food revenue. If a month shows consumption of Rs 8,80,000 against food sales of Rs 27,50,000, your food cost percentage is 32 percent. That one figure decides whether a menu is priced to survive, and it is the first line most owners and lenders look at on a restaurant profit and loss statement.
What is food cost percentage, and how is it different from food cost?
Food cost is a rupee figure: the value of ingredients used to produce what you sold. Food cost percentage is that figure expressed against sales, which lets you compare a small tea stall with a large multi-cuisine kitchen on the same scale. A dish that costs Rs 115 to plate tells you little on its own; the same dish sold at Rs 350 excluding GST carries a 33 percent food cost, and now you can judge it. Percentage is what makes the number portable across outlets, across months and across menu items.
The distinction matters when you read numbers off a report. A rising rupee food cost is normal when sales rise. A rising food cost percentage is the warning: it means each rupee of sales is buying more ingredient cost than before, so something in purchasing, portioning or pricing has slipped.
The food cost percentage formula, step by step
The period formula that ties to your books is straightforward. Do it monthly at minimum, weekly if you can.
- Take opening stock at the start of the period, valued from your last physical count.
- Add purchases for the period at invoice value (see the GST note below on whether that is gross or net).
- Subtract closing stock from a fresh physical count on the last day.
- Subtract non-sale transfers: staff meals, complimentary covers and inter-outlet issues, so they do not inflate the cost of what you sold.
- The result is cost of food consumed. Divide it by food sales net of GST and multiply by 100.
For a single recipe, the logic is the same at plate level: add the as-purchased cost of every ingredient, adjust for yield loss during cleaning, trimming and cooking, divide by the number of portions to get cost per plate, then divide cost per plate by the menu price excluding GST. Recipe-level costing draws on the same bill of materials thinking a factory uses, which is why disciplined inventory and costing is the backbone of food cost control.
What is a good food cost percentage for an Indian restaurant?
There is no single ideal number; the target depends on format. What 30 percent means is simple enough: thirty paise of every rupee of food sales went into ingredients, leaving seventy paise to cover rent, salaries, power, aggregator commission and profit. A 33 percent food cost implies three paise less of that cushion per rupee, which is material once fixed costs are heavy. The practical ceiling for most sit-down formats is around 38 percent; beyond that, either the menu is under-priced or the kitchen is leaking.
| Format | Typical food cost % | What drives it |
|---|---|---|
| Quick service (QSR) | 25 to 30% | Tight standard recipes, high volume |
| Casual dining | 28 to 33% | Broad menu, moderate portions |
| Fine dining | 30 to 38% | Premium ingredients, high wastage risk |
| Bar and beverage | 18 to 25% | High mark-up on drinks |
| Cloud kitchen | 30 to 35% | Aggregator commission squeezes menu price |
Cloud kitchens deserve a caution: the menu price you cost against should be your listed price, but aggregator commission and marketing spend eat the margin after that. Read food cost alongside commission, which we cover in TDS on aggregator commission, rather than in isolation.
Theoretical versus actual: where the money leaks
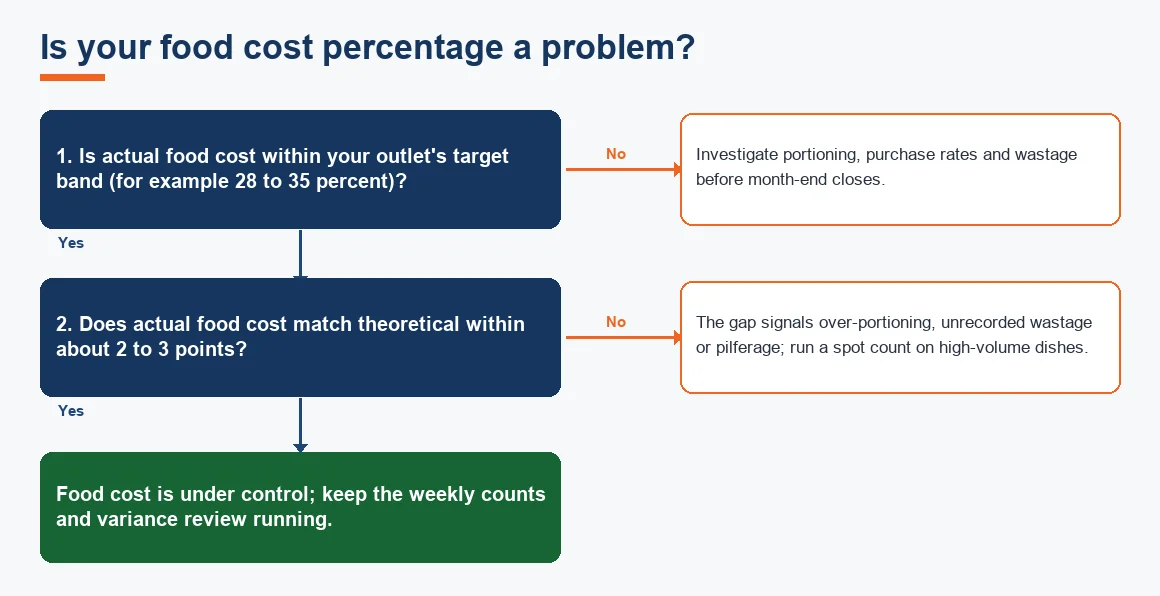
Theoretical food cost is what your recipe cards say you should have used to produce the dishes sold. Actual food cost is what your stock counts say you did use. The difference is the leak, and it is where control lives. A 2 to 3 point gap is normal; a persistent gap wider than that points to over-portioning, unrecorded wastage, spoilage or pilferage.
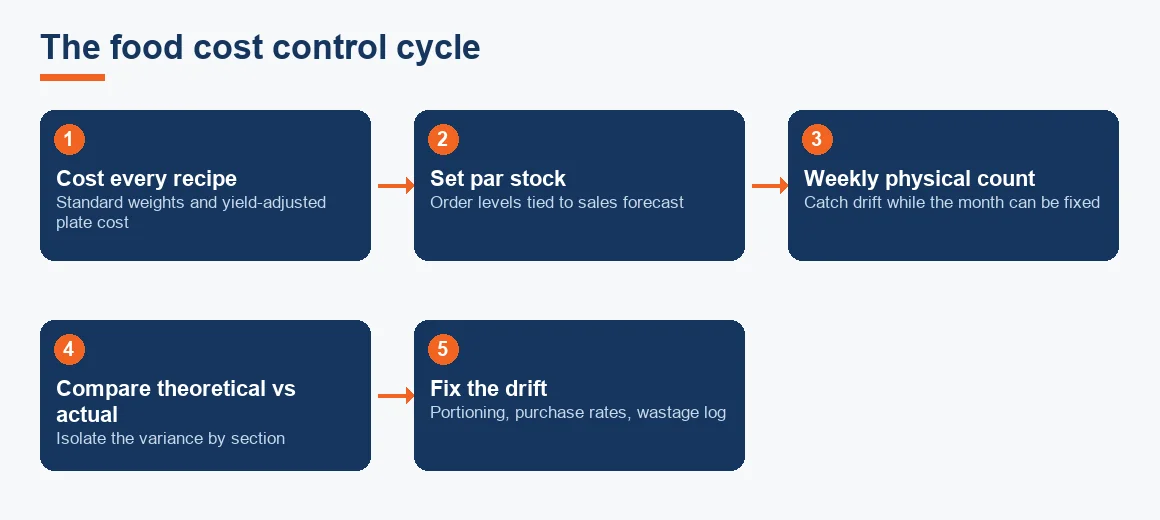
The discipline that closes the gap is boring and it works: cost every recipe, fix portion sizes with standard weights and scoops, run a weekly physical count, and record wastage in a separate ledger instead of burying it inside consumption. A weekly count catches drift while the month can still be corrected. This is ordinary variance analysis, and the recurring food cost variance percentage is the metric to put on a manager's weekly review, ideally as part of your MIS reporting.
Worked example: a month of food cost
Here is a single outlet for the month of July, reconciling stock movement to sales and then comparing the actual result with the theoretical figure from recipe cards. All amounts are indicative and in rupees.
| Line | Amount (Rs) |
|---|---|
| Opening stock (1 Jul) | 3,20,000 |
| Add: Purchases (incl. GST, 5% scheme) | 8,50,000 |
| Less: Closing stock (31 Jul) | 2,90,000 |
| Less: Staff meals and complimentary covers | 40,000 |
| Cost of food consumed | 8,40,000 |
| Food sales (net of 5% GST) | 27,50,000 |
| Actual food cost % | 30.5% |
| Theoretical food cost % (recipe cards) | 28.2% |
| Variance | 2.3 points |
Consumption is 3,20,000 plus 8,50,000 minus 2,90,000 minus 40,000, which is 8,40,000. Divided by net sales of 27,50,000, that is 30.5 percent. Against a theoretical 28.2 percent, the 2.3 point variance is within a tolerable band but worth a spot check on the two or three highest-volume dishes. Note the purchases are booked including GST, because a 5 percent restaurant cannot claim input credit, so the tax sits inside the cost.
How do I use food cost for menu pricing?
Turn the target into a price. If you want a 30 percent food cost on a dish that costs Rs 90 to plate, divide the plate cost by the target: Rs 90 divided by 0.30 is Rs 300 as the menu price excluding GST. That is the floor, not the answer, because you still layer in what the market will bear and what the dish contributes in rupees, not just percentage. A high-percentage dish that sells in large numbers can contribute more absolute margin than a low-percentage dish that rarely sells, which is why owners track a contribution margin view alongside percentage.
What is food cost in the P&L?
In a restaurant profit and loss statement, food cost is the largest component of cost of goods sold, sitting directly below revenue and above the gross profit line. Sales minus food cost (and beverage cost, tracked separately) gives gross profit; below that sit labour, rent, utilities and the rest. Because it is the first and biggest deduction, a two point improvement in food cost percentage flows almost entirely to the bottom line. Valuing the opening and closing stock consistently, whether on FIFO or weighted average, is what keeps the P&L honest month to month. For the full build of the statement, see our guide on the restaurant P&L statement.
How GST changes the food cost figure
Standalone restaurants charge GST at 5 percent and cannot claim input tax credit on their purchases, so ingredients must be booked at invoice value including GST. If you record purchases net of tax out of habit, you understate food cost and overstate margin: the tax is a real cost you never recover. Restaurants operating in specified premises, broadly where a unit of accommodation in the same premises exceeded Rs 7,500 per day in the preceding year, charge 18 percent and do book purchases net of the credit they can claim. Confirm your category before you decide how to record purchases; the rate and credit position are set out by the CBIC and reflected on the GST portal. Our slab-wise walkthrough of GST on hotel rooms and restaurant food covers the boundary in detail.
Key terms
- Cost of Goods Sold: the direct cost of what you sold, of which food cost is the largest slice in a restaurant.
- Food Cost Variance Percentage: the gap between theoretical and actual food cost, the core control metric.
- Inventory Shrinkage Provision: an accounting allowance for stock lost to wastage, spoilage or pilferage.
- Point-of-Sale (POS) Day-End Audit: the daily reconciliation of POS sales to cash and covers that feeds accurate food sales figures.
- FIFO vs Weighted Average Cost: the two common bases for valuing kitchen stock consistently.
Tracking food cost in Excel and at month-end
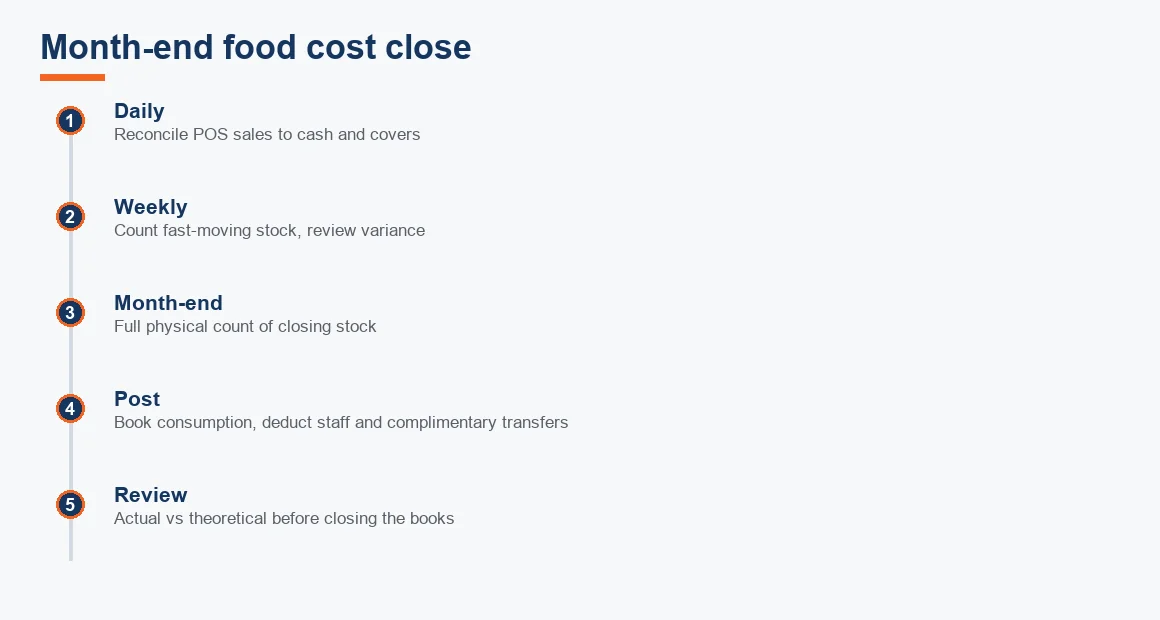
You do not need expensive software to start. A weekly spreadsheet with opening stock, purchases, closing stock, transfers, consumption and net sales columns will compute the percentage for you, and a simple formula (consumption divided by net sales) gives the answer per outlet. The rhythm matters more than the tool: reconcile POS sales daily, count fast-moving stock weekly, do a full physical count at month-end, then post consumption and review the variance before you close the books.
As you grow to multiple outlets, or add a central store where kitchen requisitions replace purchase invoices as the cost base, the spreadsheet strains and it is worth moving the process into proper accounting. That, along with aggregator reconciliation covered in our note on OTA settlement reconciliation, is the sort of ongoing work our Hotel and Restaurant Accounting team handles for owners who would rather run the floor than the ledgers. Kitchen equipment also carries its own depreciation that belongs below the food cost line, not inside it. The same costing discipline shows up across sectors, whether that is software company accounting, SaaS accounting or startup accounting, but for a kitchen it always comes back to the count.
Key takeaways
- Food cost percentage equals cost of food consumed divided by food sales net of GST; do it monthly at least, weekly if you can.
- Targets are format-specific: roughly 25 to 30 percent for QSR, 28 to 35 percent for full-service, below 25 percent for a bar.
- The theoretical-versus-actual gap is your control lever; a persistent gap beyond 2 to 3 points signals over-portioning, wastage or pilferage.
- Standalone restaurants on 5 percent GST get no input credit, so book purchases including tax or you will overstate margin.
- Price to a target percentage as a floor, then adjust for volume and absolute contribution per dish.
Decision guide