
In this guide
A restaurant profit and loss statement is a monthly report that starts with net sales (excluding GST), subtracts cost of goods sold to reach gross profit, then subtracts labour, rent, utilities, aggregator commission and other running costs to reach EBITDA, and finally deducts depreciation, interest and tax to arrive at net profit. What makes the restaurant version different from a generic Profit & Loss Statement is that food cost, labour and wastage are broken out on their own lines, and channel costs like delivery commission are kept visible instead of buried in overheads. This guide walks through the format, the calculation and one full worked example.
What does P&L mean in a restaurant?
P&L is short for profit and loss. In a restaurant it answers one question: after you pay for the food, the kitchen and floor staff, the rent and the aggregators, what is actually left? Most outlets look busy and still lose money, because a full dining room does not tell you whether food cost crept up or whether delivery commission ate the margin. The P&L is the one report that separates turnover from profit. It reads top to bottom as a waterfall, with each cost group deducted in turn, so you can see exactly where a rupee of sales goes. Reading it every month, not once a year at tax time, is what lets an owner catch a problem while it is still fixable.
The restaurant profit and loss format
A clean outlet P&L groups its lines in the order that costs actually behave. Net sales sit at the top, split by channel so you can see which channel carries the margin. Then come the two costs that move with every plate sold, food and labour, followed by the fixed costs of occupying the space, then the variable channel and marketing costs, and finally the costs that have nothing to do with day-to-day service.
- Net sales
- Dine-in, delivery and takeaway, each on its own line, always net of the 5% GST collected.
- Cost of goods sold
- Food and beverage consumed, calculated as opening stock plus purchases minus closing stock, not simply purchases for the month.
- Labour
- Kitchen and floor wages, plus PF, ESI and the cost of staff meals.
- Occupancy
- Rent, common area maintenance and utilities (power and gas run high in a kitchen).
- Channel and other operating costs
- Aggregator commission, packaging, marketing, repairs and small wares.
- Below the line
- Depreciation on kitchen equipment and fit-out, interest on loans, and tax.
Because we run separate industry P&L formats for other sectors too (for example our notes on IT & Software Company Accounting and SaaS Accounting), the grouping principle is the same everywhere: put the two or three costs that make or break the margin at the top, where they cannot hide.
What are the three largest accounts on a restaurant P&L?
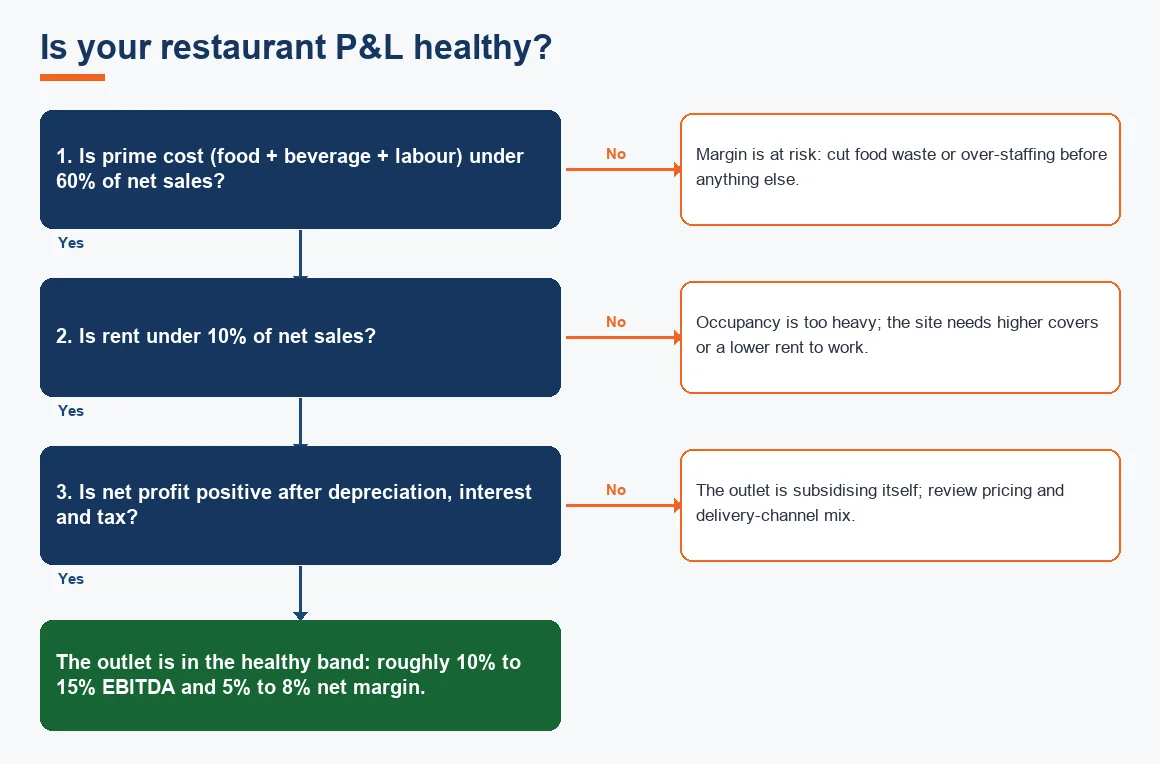
For almost every Indian restaurant the three biggest lines are food cost, labour and rent, in that order. Food cost and labour together are called prime cost, and rent is the largest of the fixed costs. If these three are under control, the outlet is usually profitable; if any one drifts, net profit disappears quickly because the remaining lines are too small to absorb the slip. That is why the format above deliberately places food, labour and occupancy near the top, and why our related note on how restaurants should track food cost percentage treats that single number as the earliest warning signal.
How to make a P&L for a restaurant, step by step
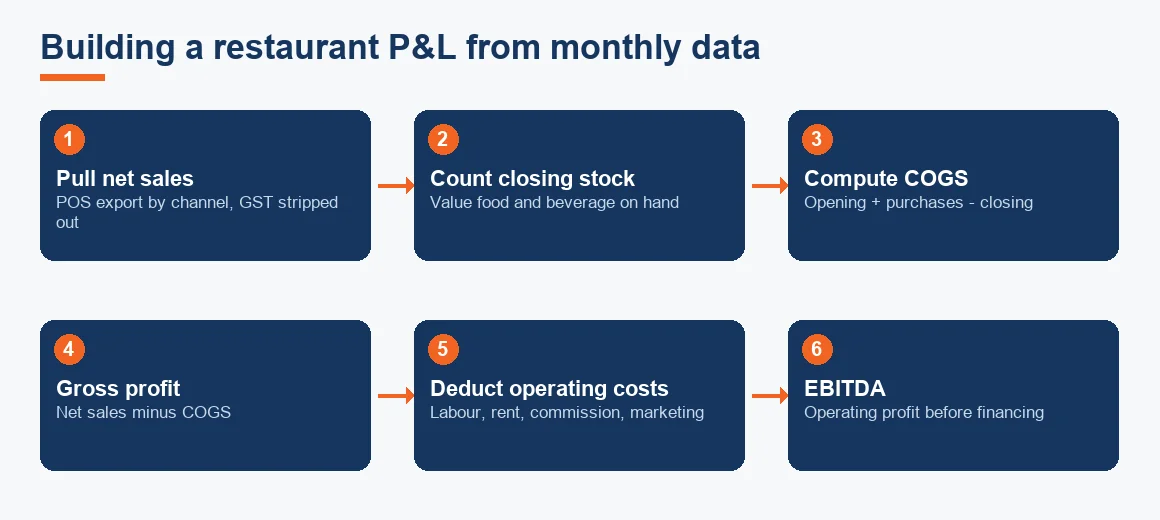
You do not need special software to build the first version. A monthly stock count, your POS sales report and your expense ledger are enough. The steps below turn those three inputs into a finished statement.
- Pull net sales from the POS. Export dine-in, delivery and takeaway separately and strip out the 5% GST, which is a liability, not income.
- Count closing stock. Value food and beverage stock on hand at month-end so cost of goods sold reflects what was consumed, not just bought.
- Compute cost of goods sold. Opening stock plus purchases minus closing stock, split into food and beverage.
- Subtract to gross profit. Net sales minus cost of goods sold gives gross profit.
- List operating costs. Labour, rent, utilities, aggregator commission, packaging, marketing and repairs, each on its own line.
- Reach EBITDA, then net profit. Gross profit minus operating costs is EBITDA; deduct depreciation, interest and tax to reach net profit.
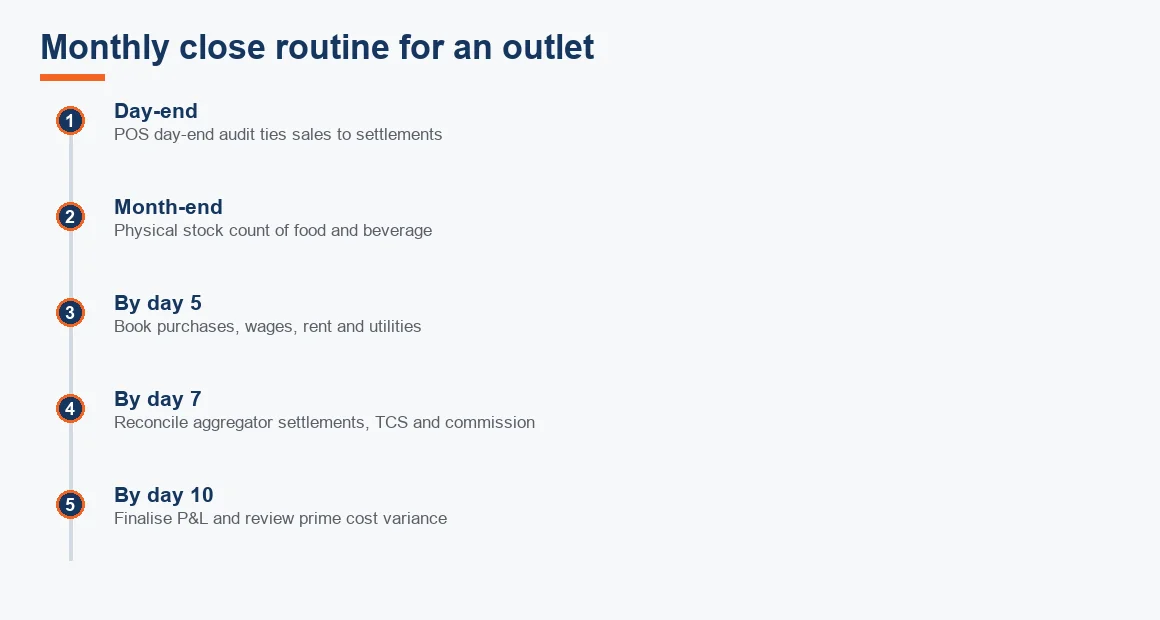
Once the structure is stable, the same routine can run every month as part of a fixed close calendar, which keeps the numbers comparable period to period.
What is the PNL formula for a restaurant, and prime cost?
The core formula is simple: Net Profit = Net Sales minus Cost of Goods Sold minus Operating Expenses minus Depreciation, Interest and Tax. The most useful sub-total inside it is prime cost, which is food cost plus beverage cost plus total labour. Prime cost is the number experienced operators watch weekly, because it captures the two costs that move with volume and it is the fastest to correct. On Rs 10,00,000 of monthly net sales with Rs 3,40,000 of cost of goods sold and Rs 2,20,000 of labour, prime cost is Rs 5,60,000, or 56% of sales, which is inside the safe band.
Key terms
- Cost of Goods Sold: the food and beverage actually consumed in the period, from opening stock plus purchases minus closing stock.
- EBITDA: earnings before interest, tax, depreciation and amortisation, the outlet's operating profit before financing and asset costs.
- Point-of-Sale (POS) Day-End Audit: the nightly tally that ties POS sales to cash and card settlements before the number reaches the P&L.
- Food Cost Variance Percentage: the gap between theoretical recipe cost and actual food cost, a direct measure of wastage and portioning.
What is a good profit percentage for a restaurant?
A standalone Indian restaurant that is running well earns roughly 10% to 15% EBITDA and 5% to 8% net margin on sales, provided rent stays under 10% of revenue and prime cost under 60%. Quick-service formats can run a little leaner on food cost and a little higher on EBITDA. Delivery-heavy outlets earn less at the net line because aggregator commission takes 18% to 25% of order value before the food is even paid for. First-year outlets frequently show no net profit at all, which is normal while covers build. The table below sets the working benchmarks by format.
| Format | Food cost (% of sales) | Prime cost | Rent | EBITDA margin |
|---|---|---|---|---|
| Full-service dine-in | 28% to 35% | Under 60% | Under 10% | 10% to 15% |
| Quick-service (QSR) | 25% to 30% | Under 60% | Under 12% | 12% to 18% |
| Delivery-led / cloud kitchen | 25% to 30% | Under 55% | 5% to 8% | 5% to 10% |
How the 5% GST without input tax credit shows up
Restaurant service (other than in a hotel with declared room tariff above Rs 7,500 per day) is taxed at 5% GST with no input tax credit, under the rate notification available on the CBIC GST portal. The practical effect on your P&L is important: because you cannot claim credit, the GST charged on food purchases, rent, utilities and equipment becomes part of the expense itself and never appears as a receivable. Rent of Rs 1,00,000 plus Rs 18,000 GST is booked as Rs 1,18,000 of rent expense, in full. Only the 5% collected from customers is a liability, sitting in a GST payable account, never income. Restaurants located inside hotels with room tariff above Rs 7,500 fall under 18% with full input credit instead, so the P&L there records purchases net of recoverable tax. Our slab-wise note on GST on hotel rooms and restaurant food covers the boundary cases.
Worked example: one month, one outlet
The statement below is a single month for a mid-sized full-service outlet on Rs 10,00,000 of net sales. Depreciation on kitchen equipment and fit-out follows the rates the Income Tax Department publishes at incometax.gov.in; tax is shown at an indicative 25%. All figures are indicative and Exl GST.
| Line item | Amount (Rs) | % of net sales |
|---|---|---|
| Net sales (dine-in 6,00,000 + delivery 2,50,000 + takeaway 1,50,000) | 10,00,000 | 100.0% |
| Cost of goods sold (food 3,00,000 + beverage 40,000) | 3,40,000 | 34.0% |
| Gross profit | 6,60,000 | 66.0% |
| Labour (wages, PF/ESI, staff meals) | 2,20,000 | 22.0% |
| Prime cost (COGS + labour) | 5,60,000 | 56.0% |
| Rent | 90,000 | 9.0% |
| Utilities and CAM | 60,000 | 6.0% |
| Aggregator commission (22% on delivery) | 55,000 | 5.5% |
| Packaging | 20,000 | 2.0% |
| Marketing | 40,000 | 4.0% |
| Repairs and small wares | 20,000 | 2.0% |
| Other operating costs | 20,000 | 2.0% |
| EBITDA | 1,35,000 | 13.5% |
| Depreciation | 35,000 | 3.5% |
| Interest | 15,000 | 1.5% |
| Profit before tax | 85,000 | 8.5% |
| Tax (indicative 25%) | 21,250 | 2.1% |
| Net profit | 63,750 | 6.4% |
Every check passes: prime cost is 56% (under 60%), rent is 9% (under 10%), EBITDA is 13.5% and net margin is 6.4%, both inside the healthy band. If food cost rose from 30% to 35% of sales, gross profit would fall by Rs 50,000 and net profit would roughly halve, which is exactly why the top three lines are watched most closely.
If you would rather not maintain this by hand, sector specialists such as our Hotel & Restaurant Accounting team set up the outlet chart of accounts and monthly close for you; the same discipline underpins how we handle Startup Accounting for early-stage food brands. A depreciation calculator also helps you put a defensible number on the equipment line.
Key takeaways
- Order the P&L as a waterfall: net sales, cost of goods sold, gross profit, operating costs, EBITDA, then depreciation, interest, tax and net profit.
- Keep prime cost (food plus beverage plus labour) under 60% and rent under 10% of sales; these three lines decide profitability.
- Book cost of goods sold from a monthly stock count, not from purchase invoices alone.
- Under the 5% GST scheme there is no input credit, so tax on purchases, rent and utilities is part of the expense, never a receivable.
- Show delivery commission and packaging as their own lines so channel margin stays visible.
Decision guide