
In this guide
A chart of accounts (often shortened to CoA) is the complete, organised list of every account your business can record a transaction against, each with a name and usually a number. It is the index behind your books: every rupee that moves is posted to one of these accounts, and your balance sheet and profit and loss statement are simply those account balances grouped and totalled. Get the chart right and every report reads cleanly; get it wrong and the errors follow you for years.
Chart of accounts meaning: what a CoA actually is
Think of the chart of accounts as the filing system for your accounting. It does not hold any money or transactions itself. It only lists the labelled drawers into which transactions are filed: a bank account, a sales account, a rent account, a GST payable account, and so on. When you buy a laptop, the payment is filed under a fixed asset account; when you pay salaries, it is filed under a salaries expense account. The chart is the master list of those drawers.
Because it sits underneath everything, the chart quietly decides how your business can be measured. If you keep a single lumped account for all selling costs, you can never see what advertising alone cost you. If you split selling costs sensibly, that answer is one click away. This is why setting up the chart is a genuine design decision rather than a formality, and why our note on how to set up a chart of accounts for a small business in India treats it as one.
What are the 5 main account types in the chart of accounts?
Every chart of accounts, in any software, sorts its accounts into five top-level types. These map directly onto the two statements every business must produce.
- Assets: what the business owns or is owed, such as bank balances, fixed assets, stock and receivables. Shown on the balance sheet.
- Liabilities: what the business owes, such as payables, loans, GST payable and TDS payable. Shown on the balance sheet.
- Equity: the owners' stake, being share capital and accumulated profits. Shown on the balance sheet.
- Income: what the business earns, mainly sales of goods or services. Shown on the profit and loss account.
- Expenses: the cost of running the business, from rent to salaries to depreciation. Shown on the profit and loss account.
Assets, liabilities and equity build the balance sheet; income and expenses build the profit and loss statement. That is the whole of double-entry accounting expressed in five buckets.
So why do people say there are 7 types?
Accounting software such as Zoho Books, Xero and QuickBooks-style systems usually break two of the five into finer types so that reports total correctly. They separate cost of goods sold from other expenses, so that gross profit can be calculated, and they separate other income or expense (like interest earned or forex gain) from operating income. That gives seven working types: asset, liability, equity, income, cost of goods sold, expense, and other income or expense. It is the same five categories, just cut more usefully. Traditional Indian bookkeeping takes a different route entirely, classifying every account as personal, real or nominal, but it arrives at the identical balance sheet and profit and loss account.
Chart of accounts structure and numbering
Most charts give each account a number as well as a name, because numbers sort predictably and survive renaming. The common convention allots a range to each category:
- 1000 to 1999: assets
- 2000 to 2999: liabilities
- 3000 to 3999: equity
- 4000 to 4999: income
- 5000 to 5999: cost of goods sold and expenses
Within a range, related accounts sit near each other: 1010 might be the current account with one bank, 1011 the current account with another. A four-digit scheme is enough for most small and medium businesses. A seven-digit chart of accounts, sometimes seen in large groups, simply adds extra digits for entity, department or location, so a single number like 12-400-1010 can say "company 12, sales department, HDFC current account". You do not need that depth to start; add levels only when you genuinely report on them. Our guide to a chart of accounts numbering system and best practices covers how far to go.
Is the chart of accounts the same as the general ledger?
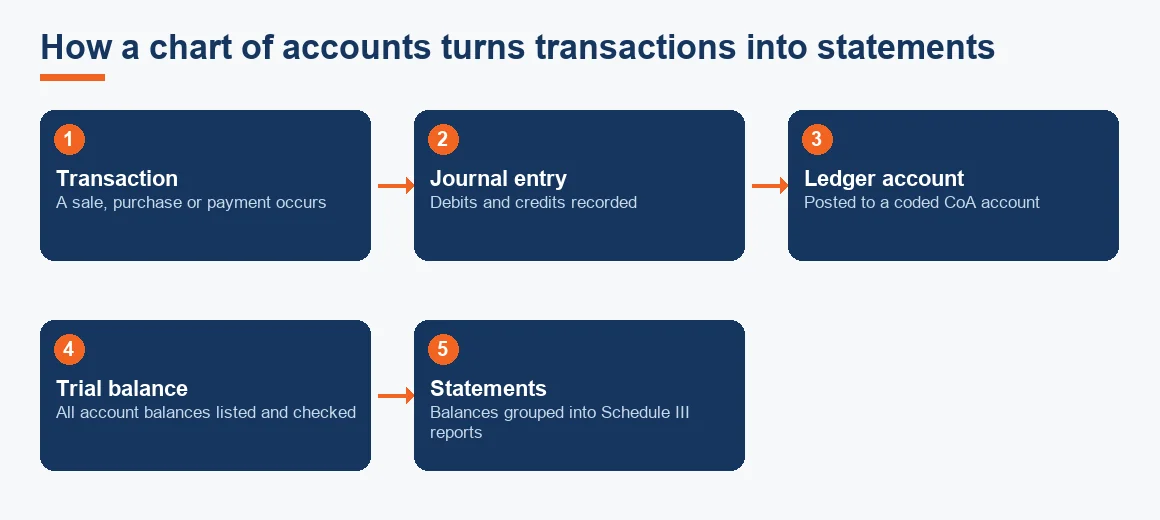
No, and confusing the two causes real trouble. The chart of accounts is the list of accounts available for posting. The general ledger is where the actual transactions and running balances live inside those accounts. One is the structure, the other is the data. Creating a new account changes the chart of accounts; passing a journal entry changes the general ledger. When you run a trial balance, you are listing every account from the chart alongside its balance from the ledger. The financial statements then take those ledger balances and group them by the chart's hierarchy.
Types of chart of accounts
Charts differ mostly in depth, not in kind. A very small business may run a flat chart of forty or fifty accounts. A growing company adds sub-accounts, so "Utilities" becomes electricity, internet and water underneath it. A group with several entities runs a segmented chart, where the account code carries extra segments for cost centre or location, letting the same "Travel" account report by department. The table below sets out the common shapes.
| Type of chart | Best suited to | Typical depth | Main trade-off |
|---|---|---|---|
| Flat chart | Sole proprietor, early-stage business | 1 level, 40 to 60 accounts | Simple, but limited analysis |
| Grouped chart | Most SMEs | 2 to 3 levels | Good balance of detail and clarity |
| Segmented chart | Multi-branch or multi-entity groups | 3 to 4 levels plus segments | Powerful reporting, heavier to maintain |
How to build a chart of accounts, step by step
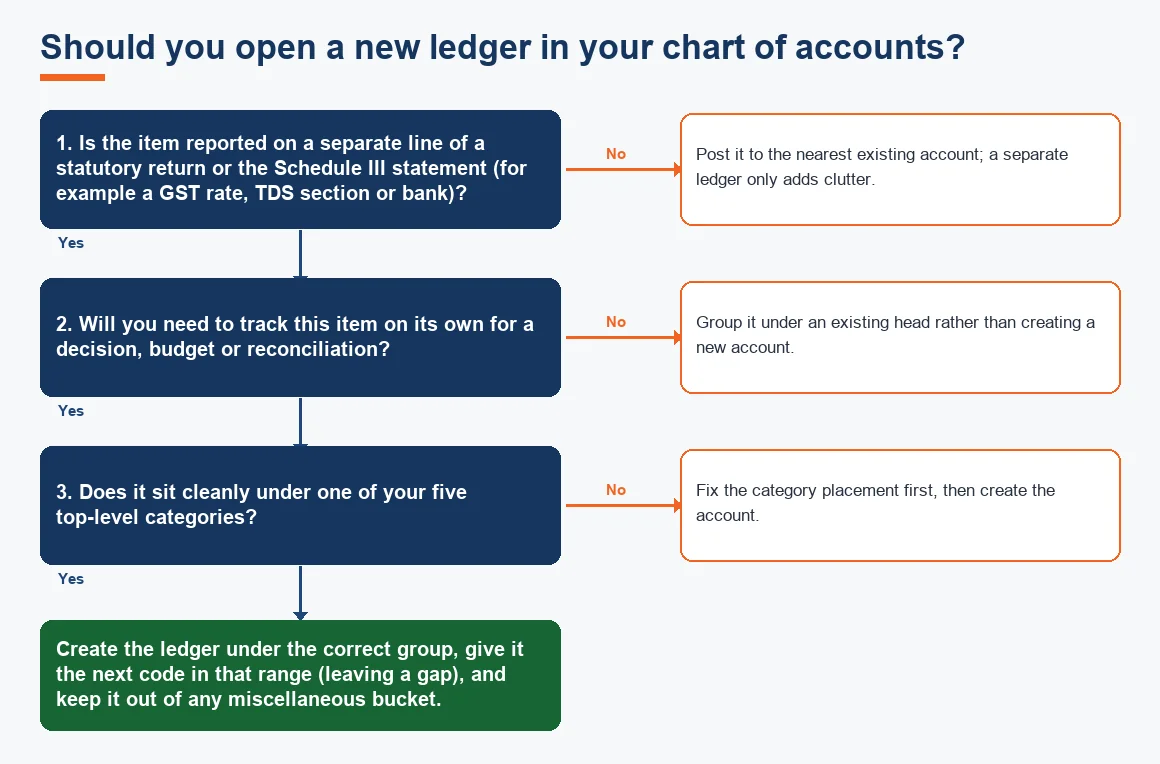
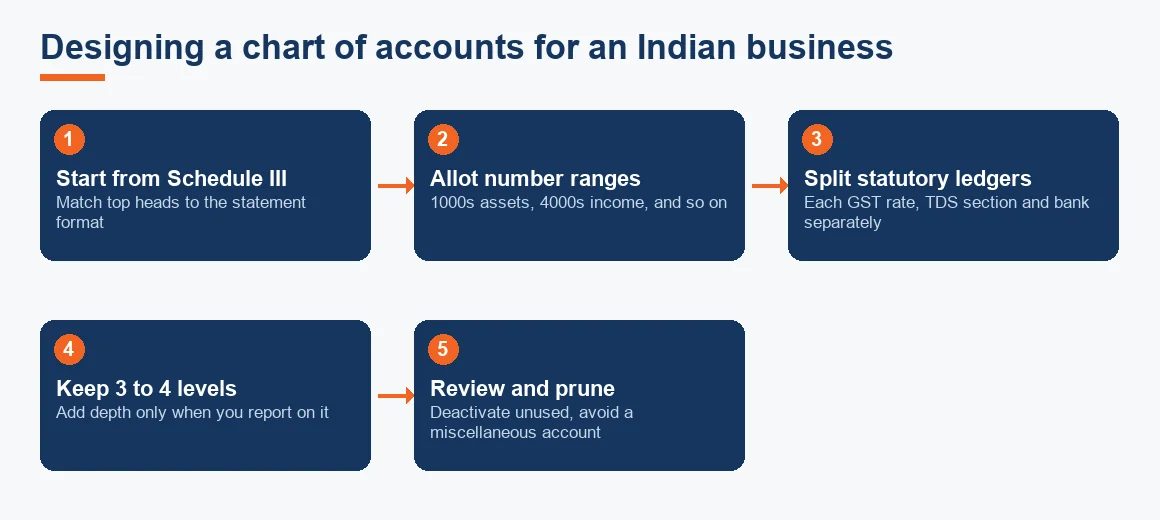
For an Indian business, the chart should be designed backwards from the reports and returns you are obliged to file. This keeps year-end painless.
- Start from the Schedule III statement format prescribed under the Companies Act, so your top-level heads already match what the balance sheet and profit and loss account must show. The format is set out by the Ministry of Corporate Affairs.
- Allot a numeric range to each of the five categories, as above.
- Keep the hierarchy to three, or at most four, levels. More is rarely worth the effort.
- Create a separate ledger for each GST rate you deal in, and separate output and input GST accounts, because these are reported line by line. Rate schedules are published by the Central Board of Indirect Taxes and Customs.
- Create a separate TDS payable ledger for each section you deduct under, such as 194C, 194J or 194Q, since each is deposited and reported separately per the Income Tax Department.
- Keep one ledger per bank account to make bank reconciliation straightforward.
- Do not create a "Miscellaneous" or "Suspense" account for regular use. It becomes a dumping ground and a guaranteed audit query.
If your books are behind and the chart needs rebuilding on historical data, that is a clean-up exercise best handled as a template-led rebuild or through structured Backlog Bookkeeping / Catch-Up work rather than piecemeal edits.
A worked example: a starter chart with GST and TDS ledgers
Below is a compact chart for a small services company. Notice how each category owns a numeric range, how the two GST accounts and the TDS section sit as separate ledgers, and how nothing is dumped into a catch-all. Amounts are illustrative opening balances only.
| Code | Account name | Category | Statement | Opening balance (INR) |
|---|---|---|---|---|
| 1010 | HDFC Current Account | Asset | Balance sheet | 4,20,000 |
| 1200 | Trade Receivables | Asset | Balance sheet | 2,65,000 |
| 1500 | Office Equipment | Asset | Balance sheet | 1,80,000 |
| 2010 | Trade Payables | Liability | Balance sheet | 1,10,000 |
| 2210 | Output GST Payable | Liability | Balance sheet | 48,600 |
| 2220 | TDS Payable (194J) | Liability | Balance sheet | 15,000 |
| 3010 | Share Capital | Equity | Balance sheet | 5,00,000 |
| 4010 | Consulting Income | Income | Profit and loss | 0 |
| 5010 | Salaries | Expense | Profit and loss | 0 |
| 5210 | Office Rent | Expense | Profit and loss | 0 |
When this company raises an invoice of INR 1,00,000 plus 18 per cent GST, the sale posts to 4010 Consulting Income (1,00,000), the GST posts to 2210 Output GST Payable (18,000), and the receivable posts to 1200 Trade Receivables (1,18,000). Every figure lands in a named account, and the trial balance stays in agreement because the debit to 1200 equals the credits to 4010 and 2210. That is the chart doing its job.
Key terms
- General Ledger: the record of actual transactions and balances held in each account of the chart.
- Double-Entry Bookkeeping: the method where every transaction debits one account and credits another by an equal amount.
- Trial Balance: a list of every account and its balance, used to check the books agree before drawing statements.
- Schedule III Balance Sheet: the statutory format under the Companies Act that a company's balance sheet must follow.
- Journal Entry: the individual record that posts a transaction to two or more accounts in the ledger.
Why a bad chart of accounts is hard to undo
The chart is easy to change on day one and painful to change on day one thousand. Once tens of thousands of transactions are posted, merging two accounts, re-mapping a GST ledger or renumbering a range means restating history and re-checking every past return. This is why the design deserves care up front, and why cleaning up a tangled chart is a specialist job. Businesses that have outgrown their original setup often route it through a dedicated Chart of Accounts Setup exercise, and pair it with tighter Accounts Payable Outsourcing and Accounts Receivable Outsourcing so that new transactions land in the right accounts from the start. If you are choosing depreciation heads while you build, our depreciation calculator and the AS vs Ind AS comparison matrix help you decide how granular the fixed asset accounts need to be.
Key takeaways
- A chart of accounts is the organised master list of every account you can post to; it is structure, not data.
- Every chart rests on five types (assets, liabilities, equity, income, expenses), often split into seven in software to isolate cost of goods sold and other income.
- The chart is not the general ledger: the chart lists accounts, the ledger holds transactions and balances.
- For Indian books, design backwards from the Schedule III format and give each GST rate, TDS section and bank its own ledger.
- Keep it lean, number with gaps, avoid a miscellaneous account, and never delete an account that carries history.
Decision guide