
In this guide
Project profitability analysis is the practice of measuring the margin earned on each individual engagement rather than across the whole firm. For a services business (a consultancy, an agency, an IT team or a professional practice) it answers a question the profit and loss account cannot: which projects make money, which quietly lose it, and why. The method is to take the revenue recognised for a project, subtract the loaded direct cost of delivering it, and read the result as both a rupee margin and a percentage. This article explains how to measure it, the ratios to watch, and where Indian statutory rules on revenue and GST fit in.
What project level profitability actually means
Firm-wide profit hides a lot. A practice can post a healthy net margin while a third of its projects run at a loss, subsidised by a handful of strong ones. Project level profitability breaks the profit line down to the engagement, so the loss makers become visible before they are repeated at the next renewal. The building block is a per-project profit and loss statement: revenue earned to date, minus the cost of the people and out-of-pocket items charged to that project, giving a contribution before firm overheads.
The discipline sits alongside broader management reporting. If you already run monthly numbers, project margin is one more cut of the same data, and it pairs naturally with your wider MIS reporting and day-to-day accounting support. For the commercial, sector-specific version of this work, see service sector accounting with project billing.
How do you measure project profitability?
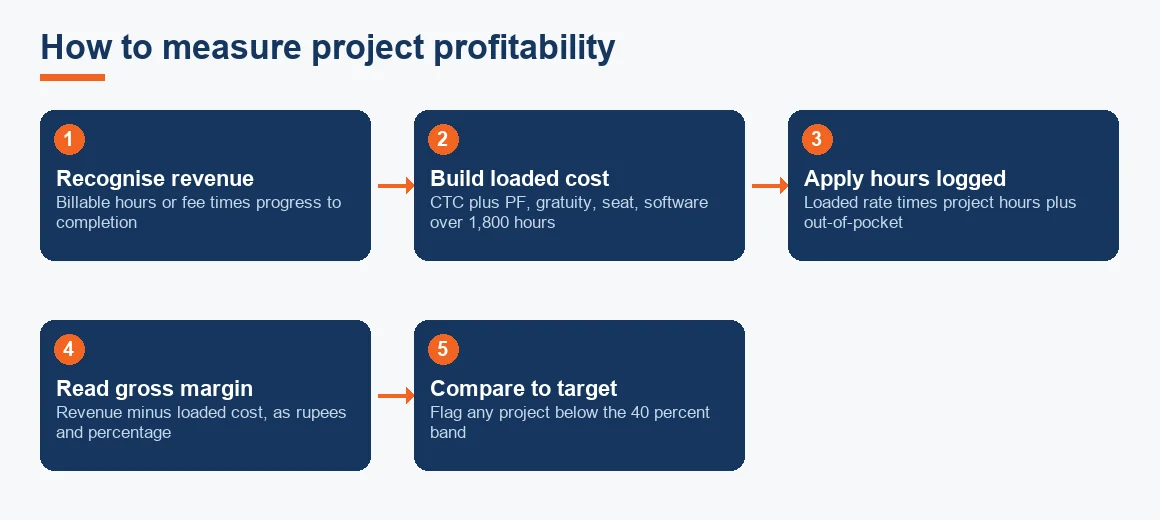
Measuring project profitability is a four-step calculation. Do it the same way every month and the numbers become comparable across engagements.
- Fix the revenue recognised. For a time-and-material project this is billable hours at agreed rates. For a fixed-fee project it is the fee multiplied by progress towards completion, not the amount invoiced.
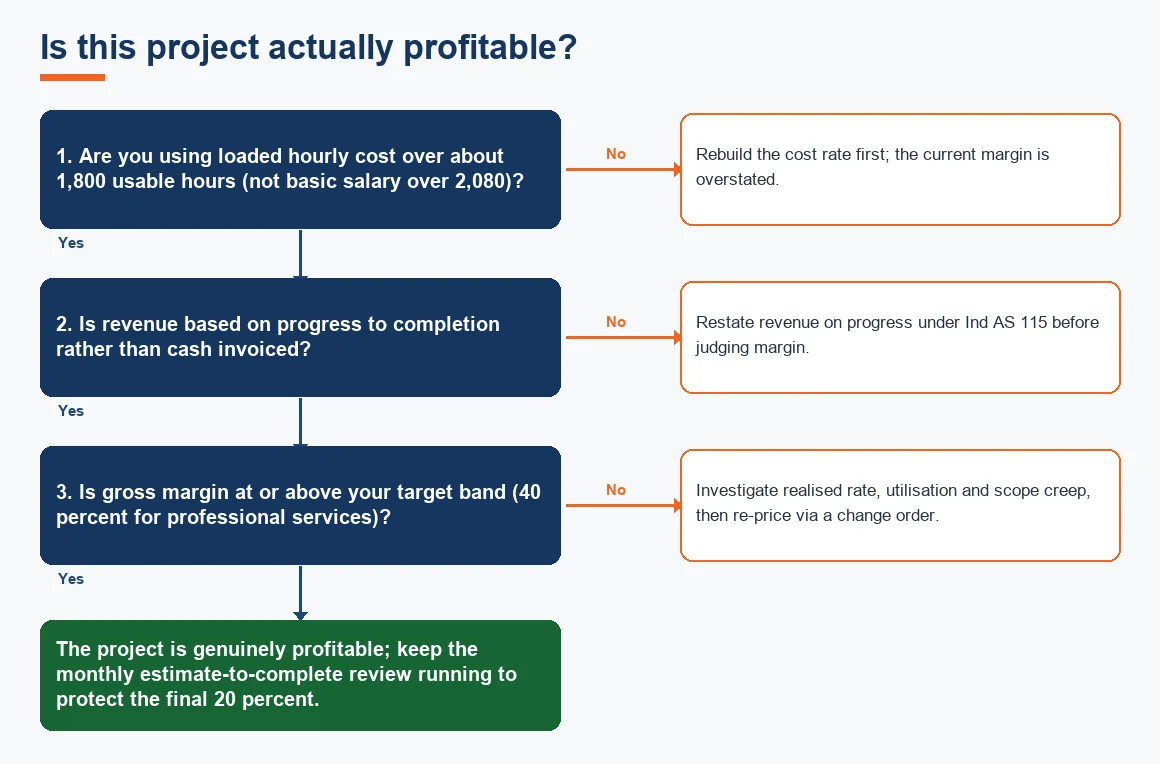
- Build the loaded hourly cost of each person. Take annual cost to company including employer provident fund, gratuity accrual and bonus, add allocated seat, software and insurance cost, then divide by realistically available hours, roughly 1,800 a year after leave and holidays. Do not divide by 2,080.
- Apply hours to the project. Multiply each person's loaded rate by the hours they logged to the engagement, and add out-of-pocket costs such as travel, sub-contractors and specific software.
- Read the margin. Revenue minus loaded direct cost is gross project margin in rupees; divide by revenue for the percentage.
The project profitability ratio and the three measures of profitability
The project profitability ratio is gross project margin divided by project revenue, shown as a percentage. It is the headline figure, but on its own it can mislead, so most firms read three measures together.
- Gross project margin percentage: revenue less loaded direct delivery cost, over revenue. This is the project-level number.
- Contribution margin: the same figure before firm overheads, used to compare projects on a like-for-like basis. A running contribution margin dashboard is the practical tool most services teams settle on.
- Net margin: after a fair share of overheads, appraisals and bench time, this is what the project leaves for the firm.
A healthy Indian professional services project earns 40 to 55 percent gross margin after direct delivery salaries and out-of-pocket costs, which leaves room for overheads and a 15 to 20 percent net margin. Staff augmentation typically runs lower at 25 to 35 percent. Below 30 percent gross margin a project cannot absorb bench time, appraisals and statutory costs.
Worked example: a fixed-fee project costing worksheet
Take a 12 lakh fixed-fee project (indicative, Exl GST) that is 60 percent complete at month-end. Revenue recognised is 12,00,000 times 60 percent, which is 7,20,000. The team has logged the hours below at loaded rates. The worksheet shows how gross margin is read.
| Item | Hours | Loaded rate (per hour) | Cost (INR) |
|---|---|---|---|
| Revenue recognised (60% of 12,00,000) | - | - | 7,20,000 |
| Senior consultant | 180 | 1,000 | 1,80,000 |
| Associate | 420 | 550 | 2,31,000 |
| Out-of-pocket (travel, sub-contractor) | - | - | 60,000 |
| Loaded direct cost | - | - | 4,71,000 |
| Gross project margin | - | - | 2,49,000 |
| Gross margin % | - | - | 34.6% |
At 34.6 percent this project is below the 40 percent target band. The costing worksheet immediately shows where: the associate hours are high relative to the fee. That is a scope or estimation problem to fix before the final 40 percent of delivery, not after.
Methods of profitability analysis and the tool used to estimate it
There are a few standard methods of profitability analysis, and services firms usually combine them rather than pick one.
- Job costing: every hour and expense is coded to a project, which is the foundation for all per-project margin work.
- Contribution analysis: ranking projects and clients by contribution margin to see who funds the firm.
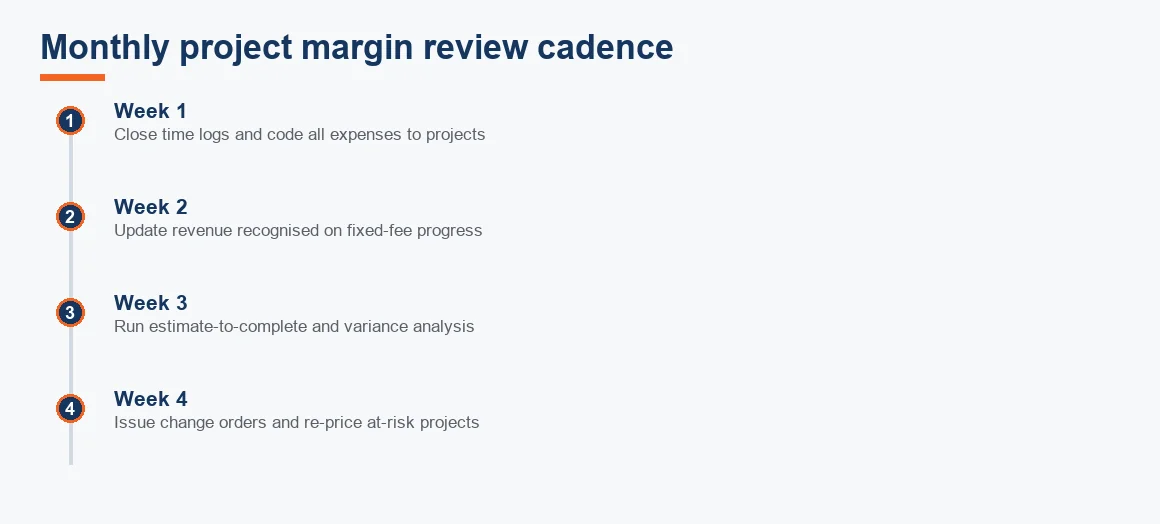
- Variance analysis: comparing the budgeted margin at sale against the actual margin at delivery. A monthly variance analysis is what turns a costing report into a management decision.
The tool used to estimate the profitability of a project does not need to be exotic. Zoho Books, Xero project tracking or a well-built spreadsheet with a time log all work, provided the loaded cost and the revenue recognition are correct. The tool is only as good as the hourly-cost assumption feeding it. To sanity-check whether Ind AS reporting rules apply to how you recognise the revenue, our Ind AS applicability checker is a quick first pass.
Indicators of project profitability to watch
Three leading indicators explain most of the swing in project margin, and all three can be read before a project closes.
- Realised rate: the effective rate you actually collect after discounts and write-offs, against the standard rate. A 15 percent write-off quietly turns a 45 percent margin into a low-30s one.
- Utilisation: billable hours against total available hours for each person. Under-utilised staff still carry full loaded cost, which lands on project margin.
- Scope creep: unbilled work in progress against the fee. Rising unbilled WIP hours is the earliest sign a fixed-fee project is heading below target.
How to improve project profitability
Improve project profitability by lifting realised rate and utilisation rather than cutting cost alone. Practically, that means a small set of habits.
- Track billed hours against total available hours for each person and cap non-billable rework.
- Re-price scope changes with a written change order before the work starts, not at the invoice stage.
- Review estimate-to-complete monthly on every fixed-fee engagement.
- Choose the billing model deliberately: retainer, milestone and time-and-material carry very different margin risk, as our note on retainer versus milestone billing sets out.
The comparison below summarises where margin risk sits by billing model.
| Billing model | Typical gross margin | Main margin risk | Best control |
|---|---|---|---|
| Time and material | 40-55% | Low realisation, write-offs | Approve rates and track utilisation |
| Fixed fee | 35-50% | Scope creep, final-stage rework | Monthly estimate-to-complete review |
| Retainer | 45-60% | Silent over-servicing | Cap monthly hours, review quarterly |
| Staff augmentation | 25-35% | Bench and low mark-up | Guarantee utilisation before hiring |
Where Indian revenue and GST rules fit in
Accurate project margin depends on recognising revenue correctly, and two statutory points matter. First, unbilled work in progress is measured at the contract revenue earned to date using progress towards completion under Ind AS 115, not at cost incurred, and it is presented as a contract asset. The mechanics are covered in our explainer on unbilled revenue and WIP for service firms. Second, GST on services falls due at the earliest of the invoice date, the date payment is received, or the date the service is provided where no invoice is issued within 30 days of the milestone, under section 13 read with section 31(2) of the CGST Act (see CBIC and the GST portal). Milestone billing therefore cannot be delayed to defer tax. For SAC codes and place of supply, our guide to GST on consultancy services goes deeper, and the Ind AS 115 standard itself is published by ICAI.
On the receipts side, remember that clients often deduct TDS under section 194J on professional fees, so your recognised revenue and your bank receipt will differ by the withheld amount; the credit is claimed via 26AS and AIS, as explained in our note on section 194J TDS for consultants and confirmed against the Income Tax Department portal. This is the same margin discipline that IT and product teams apply in SaaS accounting, IT and software company accounting and early-stage startup accounting.
Key terms
- Project-Wise Profitability Margin: gross margin measured on a single engagement rather than the whole firm.
- Unbilled Revenue (WIP Hours): work delivered but not yet invoiced, carried as a contract asset.
- Contribution Margin Dashboard: a live view ranking projects by margin before firm overheads.
- Milestone vs Retainer Billing: two billing models with different margin and cash-flow risk.
- Days Sales Outstanding (DSO): average days to collect an invoice, which affects project cash even when margin is healthy.
Key takeaways
- Measure margin per project, not just per firm, so loss makers surface before they recur.
- Use loaded hourly cost over roughly 1,800 usable hours, never basic salary over 2,080.
- Read gross margin, contribution margin and net margin together, not the ratio alone.
- Aim for 40 to 55 percent gross margin on professional services; below 30 percent is unsustainable.
- Realised rate, utilisation and scope creep drive most of the swing, so review estimate-to-complete monthly.
- Recognise revenue on progress under Ind AS 115 and bill GST milestones on time; tax cannot be deferred by delaying the invoice.
Decision guide