
In this guide
Learning how to read a balance sheet is mostly about reading it in the right order. A balance sheet is a snapshot of what a business owns and owes on a single date, arranged so that assets always equal equity plus liabilities. Once you know the three parts, the formula that ties them together and the four or five numbers a lender checks first, the statement stops looking like a wall of figures and starts telling you whether the business is solvent, liquid and worth extending credit to. This guide walks through that reading, with a worked example on real Indian figures.
What is the formula for the balance sheet?
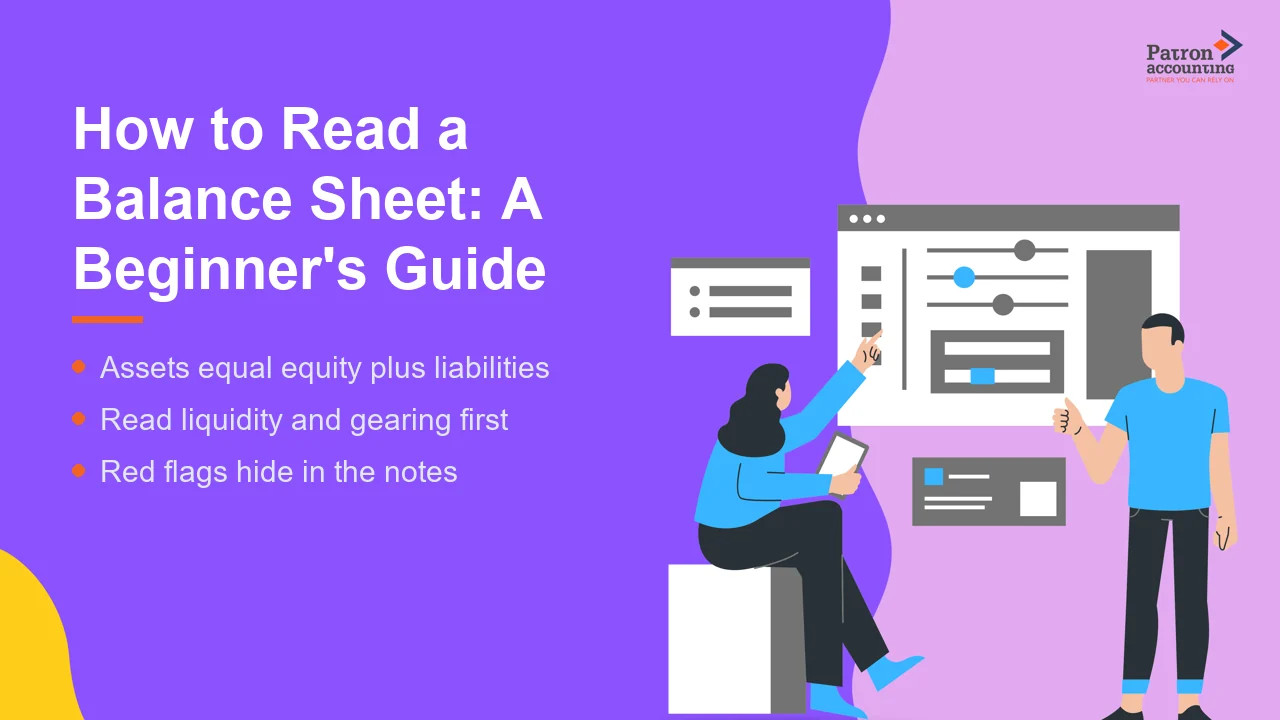
Every balance sheet rests on one identity: Assets = Equity + Liabilities. Because every transaction is recorded twice under double-entry bookkeeping, what a business controls (its assets) must equal the money put in by owners (equity) plus the money owed to outsiders (liabilities). If the two sides do not tie, the statement is wrong: there is an incomplete posting, an unresolved suspense balance or a wrong opening figure. In Tally or Zoho Books the difference in opening balances line is the usual culprit, and it has to be cleared before the accounts are finalised. A balance sheet that does not balance is never a rounding issue.
The balance sheet works alongside the profit and loss account and the cash flow statement. If you are still placing where each statement sits, our explainer on the four types of financial statements and the piece on the correct order to prepare financial statements give the wider map.
What are the 3 parts and 5 elements of a balance sheet?
The three parts are assets, liabilities and equity. Broken down further, the five elements you will see on the face of an Indian company balance sheet are:
- Assets: what the business owns or controls, split into non-current (fixed assets, long-term investments) and current assets (inventory, receivables, cash). Net fixed assets are shown after depreciation, which you can model with our depreciation calculator.
- Liabilities: what it owes, split into non-current (long-term borrowings) and current liabilities (trade payables, short-term loans).
- Equity: the owners' residual stake, being share capital plus reserves, also called shareholders' funds or net worth.
Under Schedule III of the Companies Act 2013 the format is vertical, with equity and liabilities on top and assets below, each line carrying the previous year's comparative and a note reference. Current means realisable or payable within twelve months or the operating cycle. That split between current and non-current is the whole basis of the liquidity tests that follow, so it is worth getting clear before you read on. The prescribed layout is set out in our note on Schedule III financial statement format.
How do you read a balance sheet step by step?
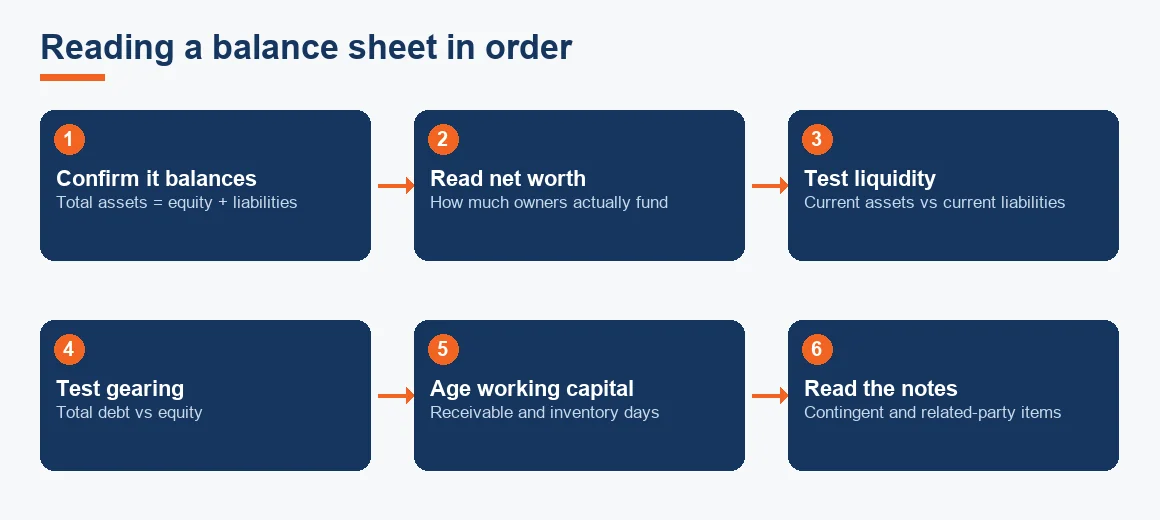
Read the statement in this sequence rather than top to bottom. Each step answers one question before you move on.
- Confirm it balances. Total assets must equal total equity plus liabilities. If it does not tie, stop; the numbers cannot be relied on.
- Read net worth. Shareholders' funds tell you how much of the business the owners actually fund. A thin or negative net worth changes how you read everything else.
- Test liquidity. Compare current assets against current liabilities. This shows whether the business can meet obligations falling due within the year.
- Test gearing. Compare total debt against equity to see how heavily the business leans on borrowed money.
- Age the working capital. Check how long money sits in receivables and inventory, using the notes.
- Read the notes. Contingent liabilities, related-party loans and accounting policies sit here, and they often matter more than the face of the statement.
How do you analyse a balance sheet with ratios?
Analysis turns the raw figures into three or four ratios a lender or investor will check first.
Current ratio
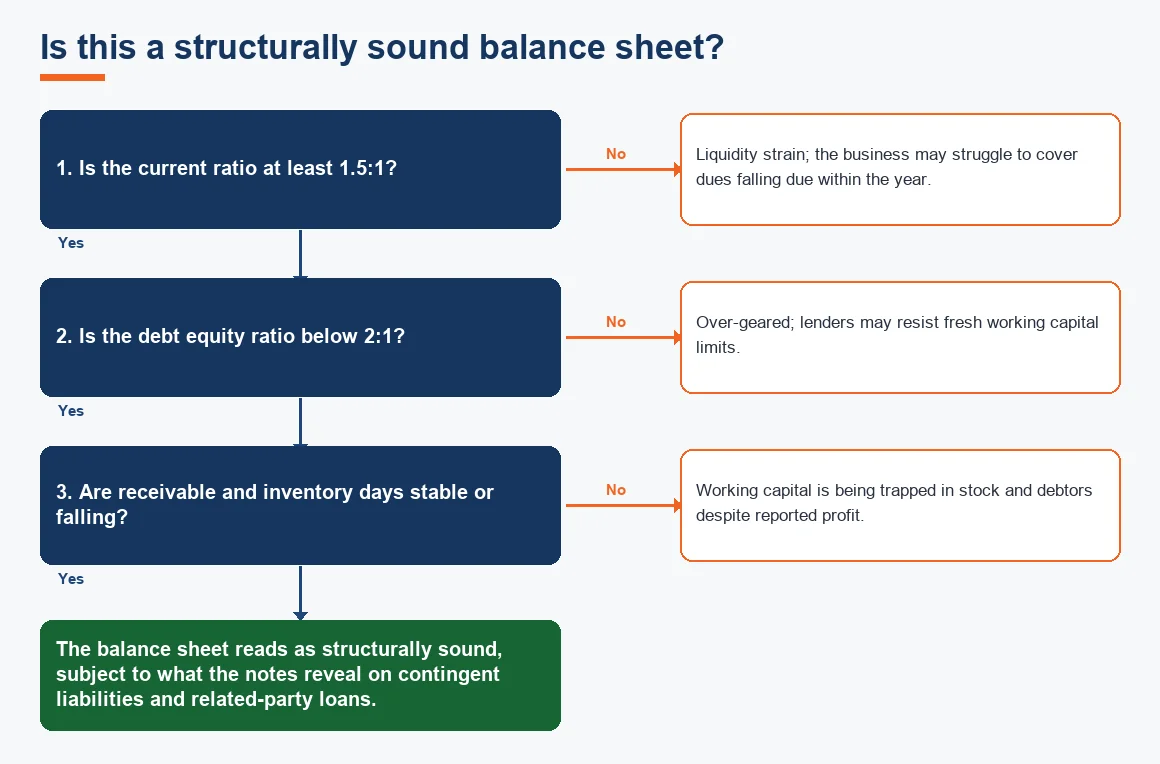
Current assets divided by current liabilities. A ratio near 2:1 is a common lender benchmark, meaning the business holds twice the short-term assets it needs to cover short-term dues. Below 1:1 it cannot cover current obligations from current assets.
Debt equity ratio
Total borrowings divided by equity. Below 2:1 is the usual comfort line; above it, the business is heavily geared and fresh working capital limits get harder to secure.
Receivable and inventory days
How many days of sales sit uncollected in debtors, and how many days of cost sit in stock. Rising days mean working capital is being trapped, even when the profit and loss account looks healthy. This is where clean accounts receivable outsourcing and disciplined accounts payable outsourcing quietly change the numbers you read here.
Schedule III now requires eleven ratios in the notes, with a written explanation for any movement beyond 25 percent, so the analysis a reader once had to build by hand is increasingly disclosed on the page. The full text of Schedule III is available from the Ministry of Corporate Affairs.
What are red flags on a balance sheet, and what are the signs of a strong one?
Strong and weak balance sheets show a consistent pattern. The table below summarises what to weigh on each side.
| Signal | Strong balance sheet | Red flag |
|---|---|---|
| Current ratio | Around 1.5:1 to 2:1 | Below 1:1, cannot cover current dues |
| Debt equity | Below 2:1, mostly own funds | Above 2:1, or negative net worth |
| Receivables | Stable or falling collection days | Ageing debtors, large amounts over 180 days |
| Inventory | Turns steadily, matches sales | Rising stock while sales flat or falling |
| Notes to accounts | Few contingent items, no related-party loans | Heavy contingent liabilities, director loans, qualified audit |
| Reserves | Growing retained earnings | Accumulated losses eroding capital |
Worked example: reading a small company balance sheet
Take a private company with total assets of Rs 1,00,00,000 as on 31 March. Reading it in order shows how the numbers connect. All figures are illustrative.
| Line item | Amount (Rs) | What it tells you |
|---|---|---|
| Non-current assets (net fixed assets) | 40,00,000 | Long-term productive base |
| Current assets (inventory 25L, receivables 30L, cash 5L) | 60,00,000 | Feeds the liquidity test |
| Total assets | 1,00,00,000 | Must equal the side below |
| Shareholders' funds (net worth) | 45,00,000 | Owners' stake |
| Non-current liabilities (long-term loans) | 25,00,000 | Long-term debt |
| Current liabilities (payables 20L, short-term loans 10L) | 30,00,000 | Due within twelve months |
| Total equity and liabilities | 1,00,00,000 | Ties to total assets |
Now apply the ratios. Current ratio is 60,00,000 divided by 30,00,000, or 2.0:1, comfortably at the benchmark. Working capital is 60,00,000 minus 30,00,000, or Rs 30,00,000 of headroom. Total debt is 25,00,000 plus 10,00,000, or Rs 35,00,000, against equity of Rs 45,00,000, giving a debt equity ratio of 0.78:1, well below 2:1. Net worth of Rs 45,00,000 against total debt of Rs 35,00,000 clears a 2:1 gearing test easily. On these figures the business reads as solvent and liquid, subject only to what the notes reveal about receivable ageing and any contingent items.
What does your balance sheet tell you, and can you see profit on it?
The balance sheet tells you about position, not performance. It shows solvency (can the business pay what it owes over time), liquidity (can it pay what falls due soon) and how the business is funded. You cannot read the year's profit directly from it; profit lives on the profit and loss account. What you can see is the effect of profit, in growing reserves and retained earnings, and the effect of losses, in capital being eroded. A rising cash balance is not proof of profit either, which is why the cash flow statement is read alongside it to separate real cash generation from borrowing.
If the underlying books are behind or unreliable, no amount of ratio work will help; the reading is only as good as the ledger. Bringing records up to date through backlog bookkeeping and catch-up is the honest first step before any analysis. For companies that want a properly formatted, Schedule III compliant statement to read in the first place, that is the job of structured financial statement preparation.
Records must be preserved too. Section 128(5) of the Companies Act 2013 requires books of account and supporting records to be kept for eight financial years immediately preceding the current one, with an audit trail on electronic records, a point worth confirming against the Income Tax Department retention rules that run in parallel.
Key terms
- Balance Sheet: statement of assets, liabilities and equity on a single date.
- Working Capital: current assets minus current liabilities, the short-term cushion.
- Current Assets: assets expected to convert to cash within twelve months.
- Current Liabilities: obligations due within twelve months.
- Trial Balance: the ledger listing from which the balance sheet is drawn.
Key takeaways
- Assets = Equity + Liabilities is the identity that must always tie; if it does not, the numbers are wrong, not rounded.
- Read in order: balance, net worth, liquidity, gearing, working capital days, then the notes.
- Current ratio near 2:1 and debt equity below 2:1 are the lender benchmarks to check first.
- Red flags cluster in the notes, not on the face of the statement.
- The balance sheet shows position; read it with the profit and loss and cash flow statements for the full picture.
Decision guide