

In this guide
To calculate COGS in a manufacturing business you cannot simply take opening stock plus purchases minus closing stock, the way a trader does. Production adds labour and factory overhead to raw materials, so cost of goods sold (COGS) is worked out in two stages: first you build the cost of goods manufactured (COGM), then you adjust that figure for the movement in finished goods. This guide sets out both formulas, a full worked example with Indian figures, and how to read COGS out of a Schedule III profit and loss account. For the commercial side of factory books, our Manufacturing Accounting Services page covers scope and engagement.
What is COGS in manufacturing accounting?
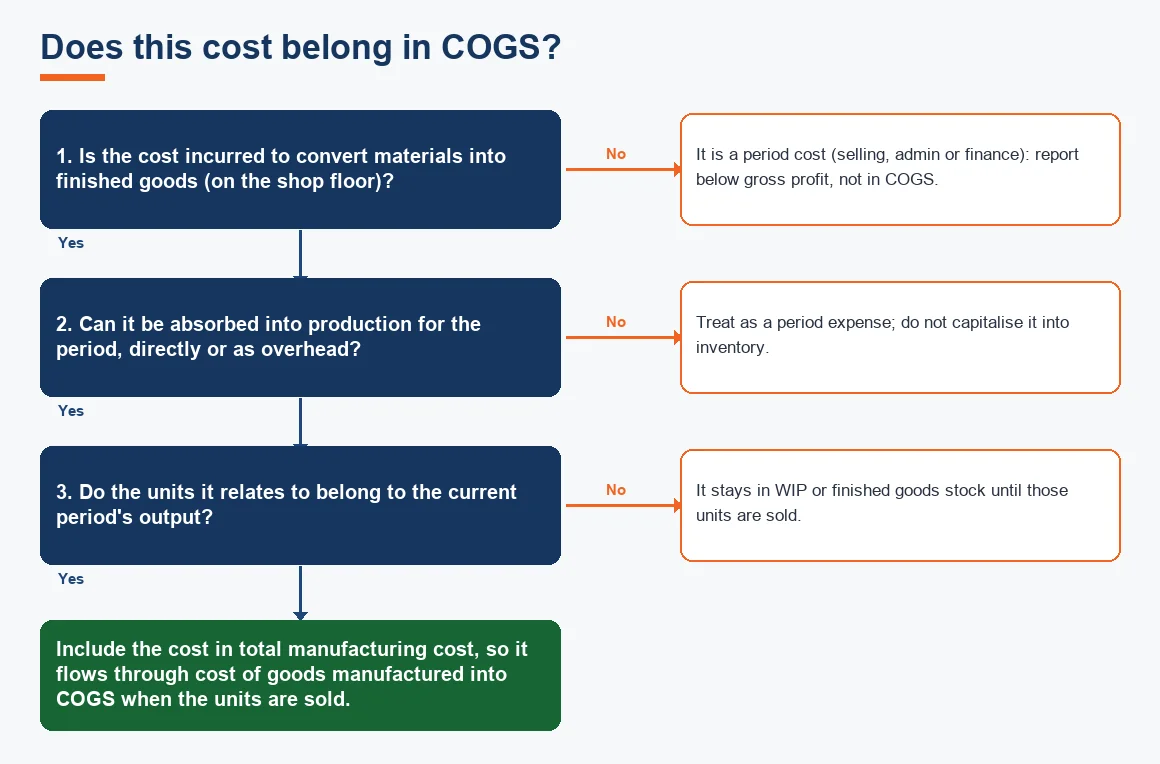
COGS is the total cost of the goods that were actually sold during a period, not the cost of everything produced or purchased. For a manufacturer, that cost has three ingredients: the raw materials consumed, the direct labour that converted them, and the factory overhead absorbed into production. Selling, administrative and finance costs sit below the gross profit line and never enter COGS. The distinction matters because gross profit (revenue minus COGS) is the number a factory owner uses to judge whether the shop floor is earning its keep, separate from office and marketing spend.
Because production runs across period ends, some units are always part-finished. Those sit in work-in-progress (WIP), and finished units waiting to be sold sit in finished goods. Calculating COGS correctly is really about tracking cost as it moves through raw material, WIP and finished goods stores. If you run distinct batches or continuous output, the costing method behind these numbers is covered in our note on process costing versus job costing.
The COGS formula and how it differs for a manufacturer
The trader's formula is familiar:
COGS = opening stock + purchases - closing stock.
A manufacturer keeps the same skeleton but replaces "purchases" with cost of goods manufactured, and uses the finished goods figure rather than a single stock number:
COGS = opening finished goods + cost of goods manufactured - closing finished goods.
So the whole exercise depends on one earlier figure: cost of goods manufactured. Get COGM right and COGS is a two-line adjustment.
Cost of goods manufactured formula and total factory cost
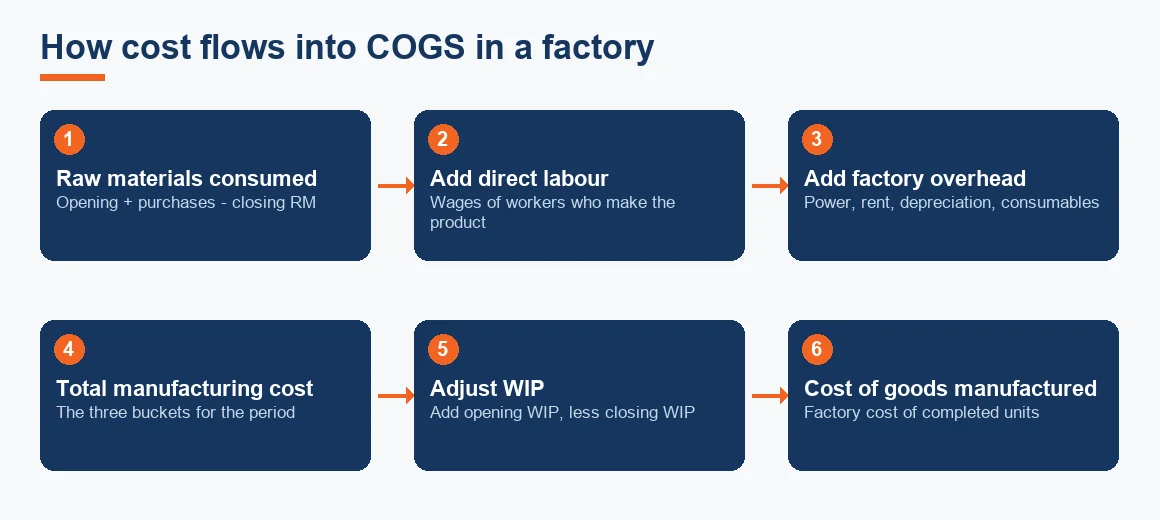
Cost of goods manufactured is the factory cost of the units completed during the period. Build it in this order:
- Raw materials consumed = opening raw materials + purchases - closing raw materials.
- Total manufacturing cost = raw materials consumed + direct labour + factory overhead absorbed.
- Cost of goods manufactured = total manufacturing cost + opening WIP - closing WIP.
Total manufacturing cost (sometimes called factory cost or works cost) is the middle line: the three cost buckets for the period before any WIP adjustment. COGM then reflects only the units that actually crossed the finish line.
The three cost buckets
Getting each bucket right is where most errors creep in. Materials should be valued using a consistent flow assumption (see the FIFO section below) and include freight and duty in the landed cost. Direct labour is the wages of workers who physically make the product, not supervisors or storekeepers. Factory overhead is every other production cost: power, factory rent, machinery depreciation, consumables and quality control. The line between production overhead and period cost is drawn in our glossary note on direct versus indirect factory overheads, and the recipe that drives material consumption is your bill of materials.
Step-by-step: calculating COGS in a manufacturing business
- Value opening and closing raw materials, WIP and finished goods on a consistent basis.
- Compute raw materials consumed (opening + purchases - closing).
- Add direct labour for the period.
- Add factory overhead absorbed to reach total manufacturing cost.
- Add opening WIP and deduct closing WIP to reach cost of goods manufactured.
- Add opening finished goods and deduct closing finished goods to reach COGS.
- Divide COGS by revenue to get the COGS percentage and compare it with prior periods.
Depreciation of plant is a real overhead in step 4, so it must be computed before you can absorb it; the Schedule II working can be run through our depreciation calculator.
Worked example: COGS for a discrete manufacturer
Take a small engineering unit for one financial year. All figures are in rupees and illustrative only. The worksheet builds COGM first, then adjusts for finished goods.
| Line | Working | Amount (INR) |
|---|---|---|
| Opening raw materials | 12,00,000 | |
| Add: raw material purchases | 60,00,000 | |
| Less: closing raw materials | (10,00,000) | |
| Raw materials consumed | 12L + 60L - 10L | 62,00,000 |
| Add: direct labour | 18,00,000 | |
| Add: factory overhead absorbed | 15,00,000 | |
| Total manufacturing cost | 62L + 18L + 15L | 95,00,000 |
| Add: opening WIP | 8,00,000 | |
| Less: closing WIP | (6,00,000) | |
| Cost of goods manufactured | 95L + 8L - 6L | 97,00,000 |
| Add: opening finished goods | 14,00,000 | |
| Less: closing finished goods | (11,00,000) | |
| Cost of goods sold | 97L + 14L - 11L | 1,00,00,000 |
If revenue for the year was 1,45,00,000, gross profit is 45,00,000 and the COGS ratio is about 69 percent, which sits inside the usual 60 to 75 percent band for Indian discrete manufacturers. A swing of more than three percentage points in a quarter usually points to scrap, rework or an unrecovered input price rise, not to genuine margin change.
FIFO or weighted average: valuing the inventory in the formula
Every stock figure in that worksheet depends on the cost flow assumption you choose. AS 2 and Ind AS 2 permit only two: first-in-first-out (FIFO) and weighted average. LIFO is not allowed, and inventory is always carried at the lower of cost and net realisable value, so obsolete or damaged stock is written down. The choice changes reported COGS whenever prices move.
| Basis | FIFO | Weighted average |
|---|---|---|
| Which costs hit COGS | Oldest purchase costs | Blended average of all purchases |
| Effect when prices rise | Lower COGS, higher profit | Smoother, mid-range COGS |
| Closing stock value | Most recent (higher) costs | Blended cost |
| Permitted under AS 2 / Ind AS 2 | Yes | Yes |
| Record-keeping effort | Batch layers to track | Simpler, one moving rate |
The deeper treatment, including net realisable value write-downs, is set out in our guide to inventory valuation under AS 2 and Ind AS 2 and the glossary note on FIFO versus weighted average cost. Whichever you pick, apply it consistently; switching methods to flatter profit is a red flag in any audit.
Reading COGS from your financial statements
A Schedule III profit and loss statement does not print COGS on a single line. Instead you add three heads: cost of materials consumed, purchases of stock-in-trade, and changes in inventories of finished goods, WIP and stock-in-trade. That sum is your cost of goods sold. Direct manufacturing wages and factory overhead are buried inside employee benefit expense and other expenses, so a manufacturer wanting a true cost-of-sales view has to pull them across manually. The presentation rules sit in Schedule III to the Companies Act, published by the Ministry of Corporate Affairs, and the inventory standard AS 2 is issued by the ICAI.
From a balance sheet alone you get only opening and closing inventory, never COGS, because the cost of goods manufactured has to come from the P&L. This is one reason well-run factories keep a standalone costing worksheet, exactly like the worked example above, rather than relying on statutory formats.
Calculating COGS without ending inventory or from gross profit
Sometimes you need COGS before the year-end physical count is done. Two shortcuts help. If you know the gross profit margin, COGS = revenue - (revenue x gross profit margin); a unit turning over 1,45,00,000 at a 31 percent margin has COGS of about 1,00,00,000, matching our example. If you have no reliable closing stock, apply a standard gross margin from prior periods to estimate COGS, then true it up once the count is available. These are estimates for management reporting, not a substitute for a proper year-end valuation under AS 2.
Key terms
- Cost of Goods Sold: the cost of the units actually sold in a period, the base for gross profit.
- Work-in-Progress (WIP) Valuation: costing of part-finished units held at period end.
- Direct vs Indirect Factory Overheads: the line between production cost and period cost.
- Bill of Materials (BOM) Costing: the recipe that drives raw material consumption per unit.
- FIFO vs Weighted Average Cost: the two inventory flow methods permitted under AS 2.
The same logic scales to other industries that carry stock or WIP. Service and software firms track unbilled effort rather than materials (see our SaaS Accounting Services and IT company accounting pages), early-stage teams should read Startup Accounting Services, and dedicated stock control sits under inventory accounting and costing services. For a full-books engagement across ledgers, our accounting services hub is the starting point, and you can sanity-check standard applicability with the AS versus Ind AS comparison matrix.
Key takeaways
- Manufacturing COGS is a two-step calculation: build cost of goods manufactured, then adjust for the finished goods movement.
- COGM = raw materials consumed + direct labour + factory overhead, adjusted for opening and closing WIP.
- COGS = opening finished goods + COGM - closing finished goods.
- AS 2 and Ind AS 2 allow FIFO or weighted average, never LIFO, at the lower of cost and net realisable value.
- Schedule III does not show COGS on one line, so keep a standalone costing worksheet for a true cost-of-sales view.
Decision guide