

In this guide
Trip-wise profit in logistics means working out the profit or loss on each individual trip or lane, rather than reading a single monthly figure for the whole fleet. You take the freight earned on a trip, subtract every cost that the trip actually consumed (diesel, toll, driver allowance, loading, maintenance share), then subtract a fair slice of the fixed costs the vehicle carries whether it moves or not. The result tells you, lane by lane, which routes fund the business and which quietly drain it. A fleet can post an acceptable monthly margin while a third of its lanes run at a loss, because the profitable trips subsidise the rest. Trip-wise costing is how you see that, and it is the core of proper Travel & Logistics Accounting.
What trip-wise profitability means for a transport business
Most transport operators track money at the wrong altitude. Diesel is booked in one lump, driver payments in another, toll in a third, and at month end the accountant reports a single profit figure. That figure is honest but useless for decisions, because it averages a Rs 12,000-profit Mumbai lane with a Rs 4,000-loss return leg into one comfortable-looking number. Trip-wise profitability breaks the fleet P&L down to its smallest revenue unit: the trip. Each trip becomes a mini profit-and-loss statement with its own revenue, its own direct costs, and its share of the fixed base. Once every trip carries its own cost, patterns appear: certain consignors always pay below cost, certain lanes never find a return load, certain drivers burn more diesel than their peers on the same route.
This is a reporting and management-accounting discipline, not a statutory filing. It sits close to the contribution margin reporting that any well-run operator needs, and it is distinct from your GST or income-tax position, which we cover separately below.
What costs go into trip-wise profitability
The whole method turns on one split: costs that move with the trip versus costs that exist whether the truck rolls or sits. The first group is allocated directly to the trip. The second group is a period cost, pooled and recovered through a per-kilometre rate so that a long trip carries more of it than a short one.
| Cost item | Treatment | How it is allocated to a trip |
|---|---|---|
| Diesel drawn | Variable (direct) | Actual litres for the trip at the day's pump rate |
| Toll / FASTag | Variable (direct) | Actual toll on the route |
| Driver bhatta and night allowance | Variable (direct) | Days on the trip at the agreed rate |
| Loading and unloading (hamali) | Variable (direct) | Actual charge at each point |
| Permit, border and green-tax charges | Variable (direct) | Actual, where the route crosses states |
| Tyre and maintenance provision | Semi-variable | Mileage-based rate per km (e.g. Rs 4 per km) |
| Insurance, road tax, permit renewal | Fixed | Per-km rate from the annual pool |
| Vehicle EMI / lease rental | Fixed | Per-km rate from the annual pool |
| Depreciation | Fixed (period) | Per-km rate (see below) |
| Office salaries and overhead | Fixed | Per-km rate from the annual pool |
Keeping tyre and maintenance as a per-km provision rather than posting the full bill in the month a tyre is changed is what stops one lane looking artificially terrible just because a set of tyres happened to be fitted that week.
How to calculate cost per km for a truck
The per-km rate is the engine of the whole model, because it is how fixed costs reach individual trips. Take each annual fixed cost, add the annual tyre and maintenance estimate, and divide by the realistic kilometres the truck will run in a year. A vehicle that runs 96,000 km a year (about 8,000 km a month) spreads its fixed base over far more distance than one parked half the time, which is exactly why utilisation drives profit.
Depreciation feeds this rate. A truck costing Rs 30,00,000, written off over six years (the useful life for motor vehicles run on hire under Schedule II of the Companies Act), gives Rs 5,00,000 a year. Over 96,000 km that is about Rs 5 per km of depreciation alone. Add insurance, road tax, EMI interest and office overhead and a typical fixed recovery of Rs 15 to Rs 20 per km is common. Our Schedule II depreciation calculator works out the annual charge for you, and for trucks on lease rather than owned, the lease accounting calculator gives the rental figure to pool instead of EMI.
How to calculate trip-wise profit: a step-by-step method
The calculation is the same for a single owner-driver truck or a 200-vehicle fleet. Only the scale changes.
- Record trip revenue. The freight billed for the trip, exclusive of GST, plus any detention or halting charges you actually recover from the consignor.
- Add up direct trip costs. Diesel litres at the day's rate, toll, driver bhatta, loading and unloading, and any permit or border charges.
- Add the maintenance provision. Loaded (and empty return) kilometres multiplied by your tyre-and-maintenance per-km rate.
- Calculate contribution. Revenue minus all of the above. This is what the trip contributes towards fixed cost and profit.
- Apply the fixed per-km recovery. Total kilometres for the trip multiplied by your fixed cost per km.
- Read the net trip profit. Contribution minus the fixed recovery. Below zero means the lane is not even covering its share of the base.
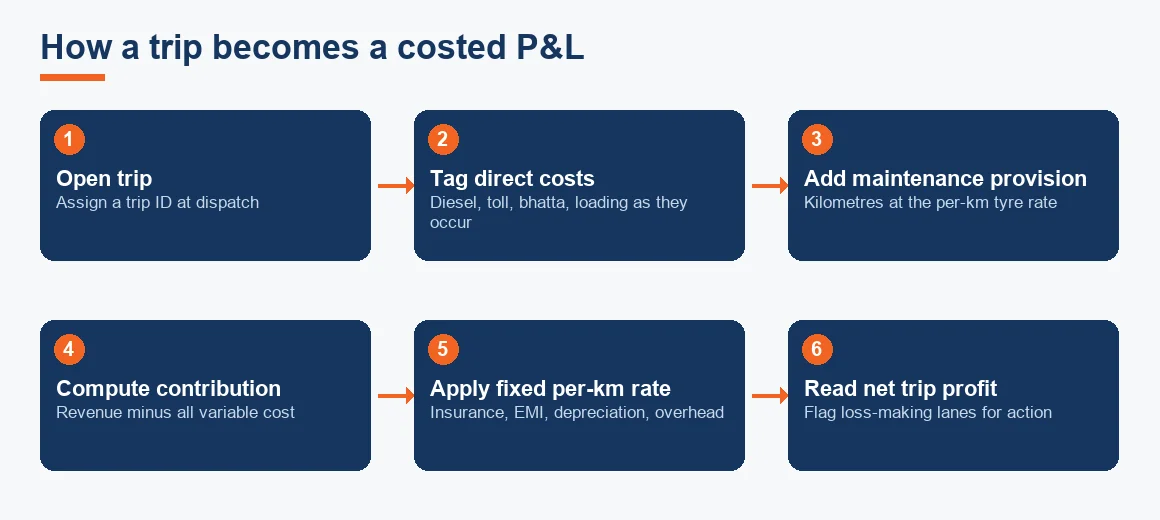
A negative contribution (step 4 below zero) is an emergency: the trip loses money before you even reach fixed cost, so the more you run that lane, the more you lose. A positive contribution but negative net profit is a utilisation problem, usually fixed by better loading or backhauls rather than by refusing the lane.
Worked example: a Mumbai to Delhi trip P&L
Take a 16-tonne truck running a 1,400 km loaded leg from Mumbai to Delhi. Freight billed is Rs 85,000 (indicative, Exl GST). The truck does about 4 km per litre, so 1,400 km needs roughly 350 litres of diesel at Rs 92 per litre. The maintenance provision is Rs 4 per km and the fixed recovery is Rs 18 per km.
| Line | Working | Amount (Rs) |
|---|---|---|
| Freight revenue (Exl GST) | Billed for the trip | 85,000 |
| Diesel | 350 litres × Rs 92 | (32,200) |
| Toll / FASTag | Actual on route | (6,500) |
| Driver bhatta and night allowance | 3 days on trip | (4,200) |
| Loading and unloading | Both ends | (2,500) |
| Maintenance provision | 1,400 km × Rs 4 | (5,600) |
| Contribution | 85,000 − 51,000 | 34,000 |
| Fixed cost recovery | 1,400 km × Rs 18 | (25,200) |
| Net trip profit | 34,000 − 25,200 | 8,800 |
The lane nets Rs 8,800, a margin of about 10.4%. Now watch what a backhaul does. If the truck picks up a Rs 55,000 return load from Delhi instead of running empty, the return leg's diesel, toll and driver cost (roughly Rs 43,000) is already partly counted, so the second load adds well over Rs 12,000 of pure contribution on a vehicle that was going home anyway. That is why empty running, not freight rates, is usually the first thing to fix.
How GST on freight changes what you record
Trip costing works on figures exclusive of GST, but you still need to know your GST position so revenue and input costs are recorded correctly. A goods transport agency (a transporter that issues a consignment note) charges either 5% GST without input tax credit or 12% with credit. Under the reverse charge mechanism, when the specified recipient (a company, factory or registered dealer) is liable, they pay the 5% instead of the transporter. Road transport of goods by anyone who is not a GTA or a courier agency is exempt. The rate you choose changes whether diesel and tyre GST is a recoverable input or a sunk cost inside your per-km rate, which is why the choice matters to costing and not only to compliance. The current notified rates are on the CBIC GST portal, and we walk through the trade-off in GTA Under GST: 5% RCM vs 12% ITC. See the glossary note on GTA RCM for the short version.
Section 44AE presumptive tax is not a substitute for costing
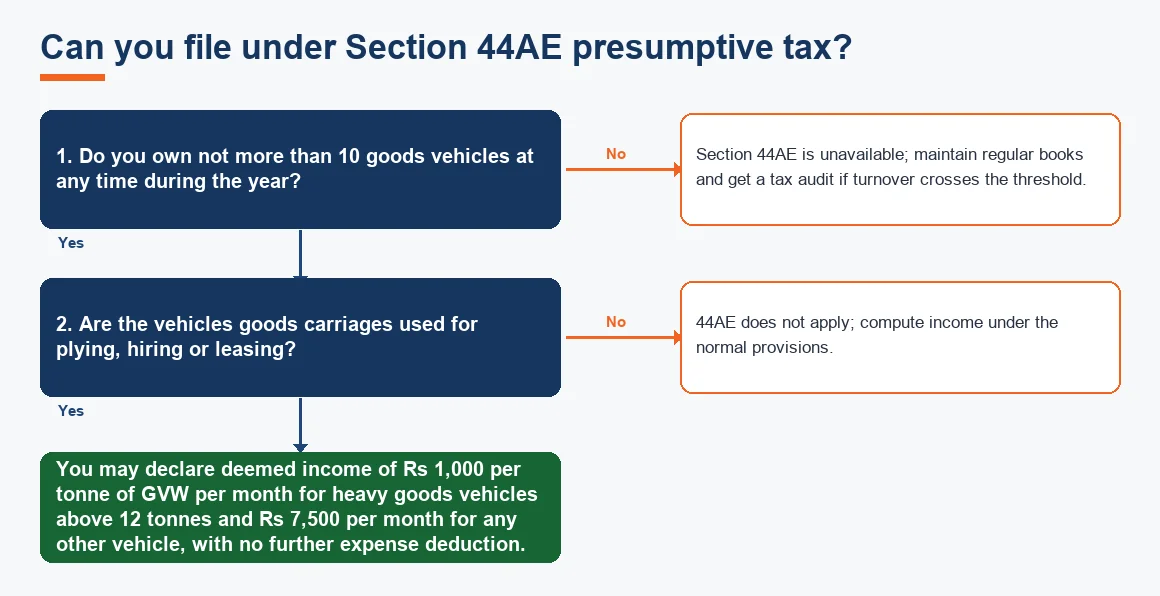
Small operators can declare income under Section 44AE of the Income-tax Act where they own not more than 10 goods vehicles at any time in the year. Income is deemed at Rs 1,000 per tonne of gross vehicle weight per month for a heavy goods vehicle above 12 tonnes, and Rs 7,500 per month for any other vehicle, with no further expense deduction. A 20-tonne truck therefore returns Rs 20,000 a month regardless of what it actually earned. This is a tax simplification, not a management tool: it tells you nothing about which lanes make money. You still need trip-wise costing to run the business, even if you file under 44AE. The section text and limits are on the Income Tax Department site.
The six-year life used above for depreciation comes from Schedule II of the Companies Act, published by the Ministry of Corporate Affairs; operators filing under presumptive tax do not claim it separately, but companies running fleets on their books do.
How to improve transport business profit margins
Once trips are costed, the levers are obvious and ranked. First, cut empty return running: a 400 km empty return on a Rs 40 per km cost base wastes about Rs 16,000, so even a low-rate backhaul beats an empty deck. Second, set mileage and tyre norms per vehicle and flag drivers who miss them. Third, plan tolls at the route level, because a marginally longer but toll-light road can beat the direct one. Fourth, bill detention and halting to the consignor instead of absorbing it. None of these need new trucks or new customers; they need the trip P&L in front of the person taking bookings.
Trip-wise profitability is one report in a wider management-accounting stack. If you also run project or industry work, the same logic drives project-wise profitability; and Patron builds the same discipline into industry pages such as IT & Software Company Accounting, SaaS Accounting and Startup Accounting. Travel intermediaries have their own quirks, covered in travel agent commission and TDS under Section 194H and TCS on overseas tour packages. For anything commercial, the parent Travel & Logistics Accounting page is the place to start.
Key terms
- Trip-Wise Profit and Loss Statement: a mini P&L drawn up for a single trip or lane, with its own revenue, direct costs and fixed-cost share.
- Goods Transport Agency (GTA) RCM: the reverse-charge mechanism under which the recipient of freight, not the transporter, pays the 5% GST.
- Fuel Fleet Card Reconciliation: matching fuel card and FASTag transactions back to trips to allocate diesel and toll accurately.
- Depreciation: the annual write-down of a vehicle's cost, converted into a per-km rate for trip costing.
- Contribution Margin: revenue less variable cost, the amount a trip contributes towards fixed cost and profit.
Key takeaways
- Cost every trip, not just the month: a healthy fleet total routinely hides loss-making lanes.
- Split costs into variable (allocated directly) and fixed (recovered through a per-km rate); depreciation is a per-km period cost, not a trip posting.
- Contribution below zero is an emergency; positive contribution but negative net profit is a utilisation problem.
- Empty return running is usually the single biggest margin leak, ahead of freight rates.
- GST choice (5% vs 12%) and Section 44AE affect tax and recording, but neither replaces the trip P&L you need to run the fleet.
Decision guide