
In this guide
Financial KPIs for MIS are the handful of numbers a management team follows every month to judge whether the business is making money, holding its cash and heading in the right direction. A useful dashboard does not report everything the accounting system can produce; it carries seven to ten measures grouped into profitability, cash and working capital, and a few operating drivers specific to the industry, each shown next to the prior month and the budget. The skill is choosing the few that change a decision and leaving the rest in the schedules behind them. This guide sets out which measures to track, the thresholds that matter and how to compute them, and it stays on the concept: if you want the underlying report built and delivered each month, that sits with our MIS Reporting Services.
What are the 5 key indicators of financial performance?
Most Indian SMEs can run a monthly review on five measures before adding anything industry specific. They answer, in order, whether the business is profitable, whether that profit converts to cash, and whether the balance sheet is stable.
- Gross margin percentage: revenue less cost of goods sold, divided by revenue. It shows pricing and input-cost discipline before overheads muddy the picture.
- EBITDA margin: earnings before interest, tax, depreciation and amortisation, as a share of revenue. It is the cleanest read on operating performance across months.
- Days sales outstanding (DSO): how long customers take to pay. Rising DSO drains cash even while the profit and loss looks healthy.
- Cash conversion cycle: days inventory plus DSO minus days payable. It measures how long a rupee is locked in working capital.
- Current ratio: current assets over current liabilities. A quick check that short-term obligations are covered.
These are lagging measures, and that is fine as a base. The difference between a report that explains last month and one that prevents next month's problem is covered further down. For the accounting definitions behind each line, our note on MIS report versus financial statements draws the boundary between management numbers and statutory ones.
The three groups every dashboard should cover
A workable front page splits into three profitability measures, three cash and working-capital measures, and two or three operating drivers. Balancing the groups stops a dashboard drifting into a profit-only view that ignores whether the money has actually arrived.
Profitability
Gross margin, EBITDA margin and net margin, each against budget. If gross margin holds but EBITDA margin slips, the problem is overhead, not pricing. Depreciation belongs below the EBITDA line; if you are unsure what the monthly charge should be, the depreciation calculator gives a Schedule II figure to book.
Cash and working capital
DSO, days payable outstanding (DPO) and the cash conversion cycle, plus the closing cash balance. Where receivables are the pressure point, tightening collections is an operations job that our Accounts Receivable Outsourcing team handles; the payables side, including supplier-payment timing, sits with Accounts Payable Outsourcing.
Operating drivers
Two or three numbers that move before the money does: order fill rate, capacity utilisation, quotation-to-order conversion or on-time delivery. These are the early warnings a purely financial dashboard misses.
What is the difference between a leading and a lagging KPI?
A lagging KPI reports an outcome already recorded, such as monthly revenue or EBITDA. A leading KPI measures an input that predicts the outcome, such as pipeline value, quotation conversion or production backlog. A dashboard carrying only lagging measures can explain last month in detail but cannot warn you about the next one. The fix is not to drop the lagging numbers, which remain the scoreboard, but to sit one or two leading measures alongside them so the review meeting can still change something. Variance analysis against budget is what turns either type into a decision rather than a data point.
The top financial ratios worth tracking
People ask for the top five ratios or the five basic ratios as if there were a fixed list. There is not, but the following set covers profitability, liquidity and efficiency for a typical trading or manufacturing SME, with a rough healthy band. Treat the benchmarks as starting points; a distributor and a software firm will read the same ratio very differently.
| Ratio | What it measures | Rough healthy band | Type |
|---|---|---|---|
| Gross margin % | Pricing and input cost | Above sector median | Lagging |
| EBITDA margin % | Core operating profit | Stable or rising month on month | Lagging |
| Days sales outstanding | Collection speed | At or below credit terms | Leading indicator of cash |
| Cash conversion cycle | Working-capital lock-up | As low as the trade allows | Lagging |
| Current ratio | Short-term solvency | 1.5 to 2.0 | Lagging |
| Quotation-to-order conversion | Demand strength | Rising trend | Leading |
Notice that days payable outstanding is deliberately not on a "push it higher" footing. Under Section 43B(h) of the Income Tax Act, payments to registered micro and small suppliers that run beyond the agreed period (capped at 45 days) are disallowed until actually paid, so stretching DPO on those vendors creates a tax cost rather than a cash saving. The provision is set out on the Income Tax Department portal.
What is KPI and MIS, and how do they fit together?
A KPI, a key performance indicator, is a single measure with a target attached. MIS, the management information system, is the reporting layer that collects those measures from the accounting software, sales data and payroll and presents them on one page. The dashboard is the visible output of the MIS; the KPIs are its content. A number only becomes a KPI when management has decided what good looks like and agreed to act when the actual diverges from it. For the wider picture of what an MIS report contains and looks like, see what an MIS report is, with formats and examples.
Worked example: computing a month's dashboard KPIs
Take a trading business with a month of activity as below. The figures are indicative. The point is that every headline KPI comes from the same trial balance, so the numbers reconcile rather than contradict each other.
| KPI | Formula | Working (INR) | Result |
|---|---|---|---|
| Gross margin % | (Revenue - COGS) / Revenue | (1,00,00,000 - 65,00,000) / 1,00,00,000 | 35% |
| EBITDA margin % | EBITDA / Revenue | 13,00,000 / 1,00,00,000 | 13% |
| Days sales outstanding | Receivables / Annual sales x 365 | 1,80,00,000 / 12,00,00,000 x 365 | 55 days |
| Days payable outstanding | Payables / Annual purchases x 365 | 90,00,000 / 7,80,00,000 x 365 | 42 days |
| Days inventory outstanding | Inventory / Annual COGS x 365 | 96,00,000 / 7,80,00,000 x 365 | 45 days |
| Cash conversion cycle | DIO + DSO - DPO | 45 + 55 - 42 | 58 days |
| Current ratio | Current assets / Current liabilities | 3,00,00,000 / 1,50,00,000 | 2.0 |
Read together, the story is clear: the business is profitable at a 35 per cent gross and 13 per cent EBITDA margin, comfortably solvent at a current ratio of 2.0, but has 58 days of cash tied up in the cycle, driven mainly by a 55-day DSO against what may be 30-day terms. That single gap is the action item the dashboard surfaces. For receivables provisioning under Ind AS, the ECL estimator helps size the expected-credit-loss charge once ageing is known.
Key terms
- EBITDA: operating profit before interest, tax, depreciation and amortisation.
- Gross profit: revenue less the direct cost of goods sold.
- Working capital: current assets minus current liabilities, the cash tied up in day-to-day operations.
- Days sales outstanding: the average number of days customers take to pay.
- Variance analysis: comparing actual results with budget to explain and act on the gap.
Vanity metrics to drop
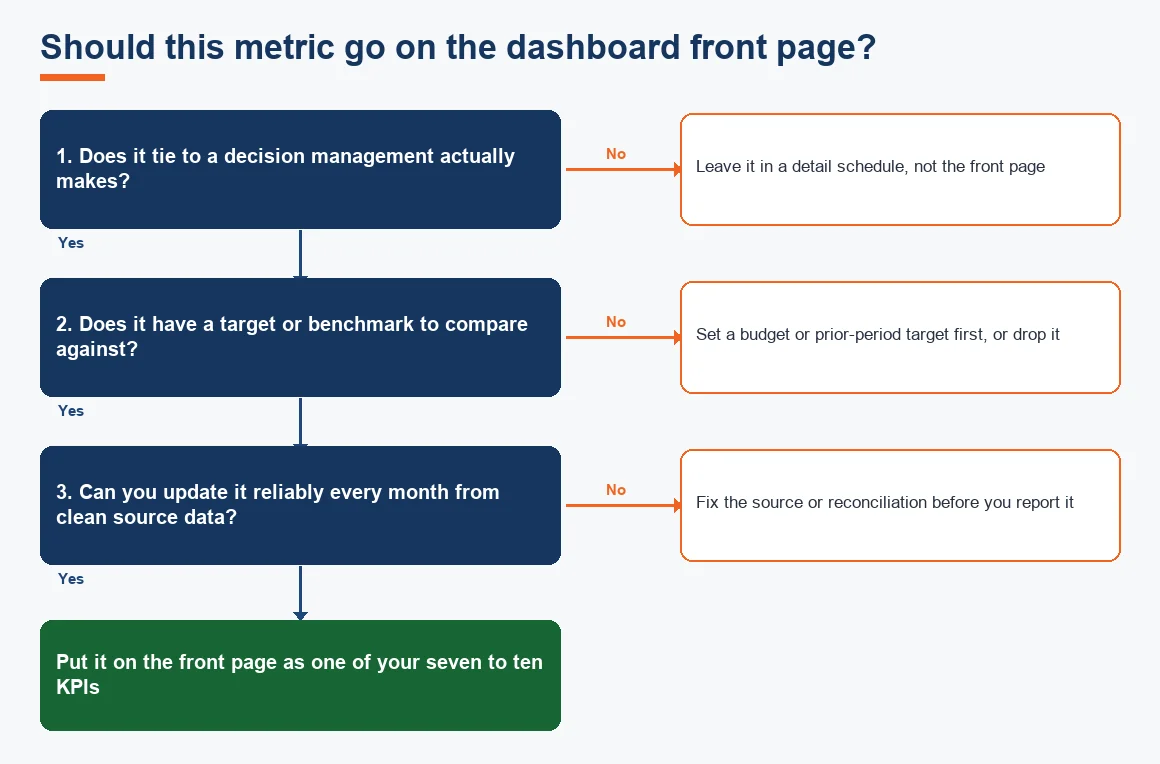
Some numbers look impressive and change nothing. Gross revenue with no margin beside it flatters a low-profit month. A cash balance shown without the payables due that week can hide a shortfall. Cumulative year-to-date totals feel like progress but bury the current month's turn. Total number of invoices, follower counts and website visits belong on other dashboards, not the financial one. The test is simple: if a rising number would not, on its own, change a management decision, it is reporting for the sake of reporting. Cutting these back to seven to ten real KPIs is usually the single biggest improvement to a review meeting.
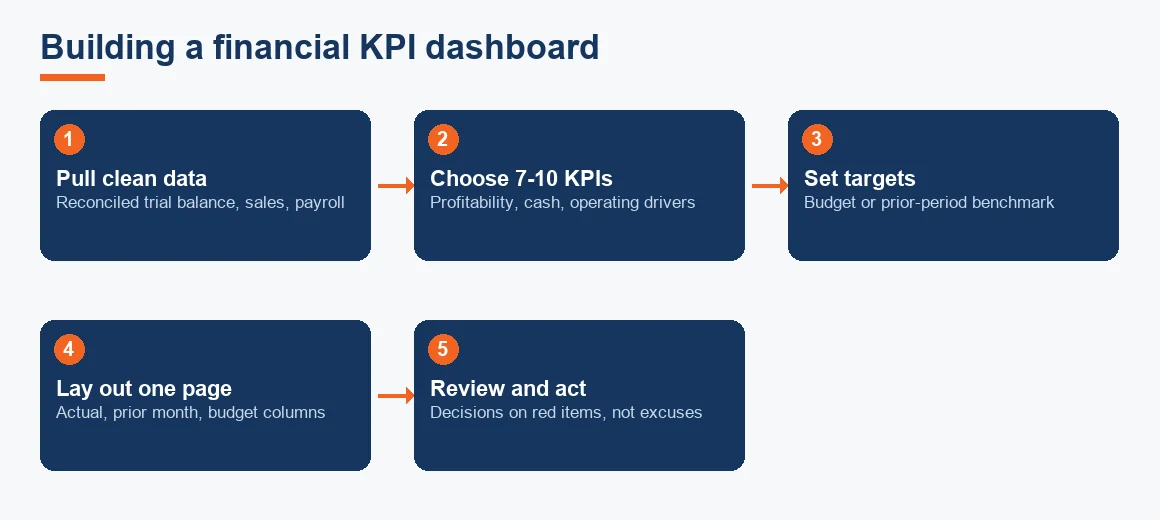
How to build the dashboard, step by step
Building a first dashboard is a short project, not a software purchase. The sequence below assumes the books are current; if they are months behind, that has to be fixed first through Backlog Bookkeeping and Catch-Up before any KPI can be trusted.
- Pull clean source data. A reconciled trial balance, the sales register and payroll for the month. Unreconciled books produce KPIs that argue with each other.
- Choose seven to ten KPIs. Three profitability, three cash and working capital, two or three operating drivers for your industry.
- Set a target for each. The budget figure, or a prior-period benchmark where no budget exists.
- Lay out one page. Actual, prior month and budget in three columns, with variance flagged.
- Review and act. Hold a monthly meeting that ends in decisions on the red items, not explanations.
If you would rather assemble it yourself in a spreadsheet first, the step-by-step walkthrough in how to create an MIS report in Excel and the ready layout in our monthly MIS report format and template give you a starting structure. Revenue recognition and cut-off should follow the presentation basis the Ministry of Corporate Affairs sets out for financial statements at mca.gov.in, and the GST liability line on the dashboard should agree to the return position on the GST portal.
Key takeaways
- Track seven to ten KPIs, not everything the ledger can produce.
- Cover three groups: profitability, cash and working capital, and operating drivers.
- Show every KPI against the prior month and the budget, or it cannot be judged.
- Blend lagging measures with one or two leading ones so the dashboard prompts action.
- Watch DPO against Section 43B(h): stretching MSME payments is a tax cost, not a cash win.
Decision guide