

In this guide
The short answer to EBITDA vs PBIT is that they sit one line apart on the same ladder. PBIT is profit before interest and tax; EBITDA is that same figure with depreciation and amortisation added back. So EBITDA is always the larger number for any business that owns machinery, vehicles, software or fit-outs. PBIT tells you what the business earned from operations after wearing the cost of its assets, while EBITDA strips that non-cash charge out to show earnings closer to operating cash. Neither is printed in your statutory accounts: only profit before tax and profit for the period appear there. This explainer walks through each measure, the formulas, and where each one is actually used, so you can read your own year-end profit line with confidence. When you need the accounts themselves prepared and closed, that is a job for Year-End Closing & Finalisation.
What does PBIT stand for?
PBIT stands for Profit Before Interest and Tax. It measures what a business earned from trading before two things that have nothing to do with day-to-day operations: how the business is financed (interest, or finance costs in Schedule III language) and how much tax it owes on the result. PBIT therefore captures the performance of the operating engine on its own, whether the company is funded by debt, by equity, or by a mix of the two.
You will often see the same figure written as EBIT, which stands for Earnings Before Interest and Tax. PBIT and EBIT are two labels for one number. Indian textbooks and older audit files tend to use PBIT; investor decks and international reports tend to use EBIT. There is no calculation difference between them, so do not waste time hunting for one.
What is the difference between EBITDA and PBIT?
The difference between EBITDA and PBIT is exactly two line items: depreciation and amortisation. EBITDA stands for Earnings Before Interest, Tax, Depreciation and Amortisation. Start from PBIT and add back the depreciation on tangible assets and the amortisation of intangible assets, and you arrive at EBITDA. Because depreciation and amortisation are always positive expenses, EBITDA is always equal to or greater than PBIT.
The logic behind the add-back is that depreciation is a non-cash charge. When you buy a delivery van, the cash leaves in year one, but the accounts spread that cost across the van's useful life as depreciation. EBITDA removes that accounting spread to show earnings closer to the cash the operation threw off. PBIT keeps the charge in, which is why PBIT is the more conservative of the two and closer to genuine economic profit for an asset-heavy business.
Are PBIT and EBITDA the same?
No. PBIT and EBITDA are only the same when a business has zero depreciation and zero amortisation, which in practice means a business that owns no fixed assets and no intangibles at all. A pure services firm working from a rented office on leased laptops might come close, but even then leasehold improvements and software licences usually create some charge. For almost every real company, EBITDA is higher than PBIT, and the gap between them is precisely the depreciation and amortisation for the year.
If you want to see how far apart they run for your own numbers, take PBIT from your management accounts and add the depreciation and amortisation figure from the notes. The wider that gap, the more capital-intensive your business is, and the more carefully a reader should weigh EBITDA against the reinvestment your assets will eventually demand.
What is the formula for calculating PBIT?
There are two ways to reach PBIT, and both give the same answer:
- Top down: Revenue, less cost of goods sold, less operating expenses, less depreciation and amortisation. This starts from the top of the profit & loss statement and works down to operating profit.
- Bottom up: Profit before tax, plus finance costs. This starts from the statutory PBT line and adds back the interest that was charged below it.
The bottom-up route is quicker at year end because PBT and finance costs are both disclosed under Schedule III, so you can lift them straight off the audited statement. To then move from PBIT up to EBITDA, add back depreciation and amortisation, which are also separately disclosed. That single reconciliation, PBT plus finance costs plus depreciation and amortisation, is the cleanest way to derive EBITDA from published accounts.
Does PBIT include depreciation?
Yes. PBIT is stated after charging depreciation and amortisation. That is the single most important thing to remember when you compare it with EBITDA, which is stated before those charges. So the answer to the common confusion is straightforward: depreciation sits inside PBIT and is removed to get to EBITDA. If someone hands you a PBIT figure that looks suspiciously close to EBITDA, check whether depreciation has actually been charged, because on a business with real assets the two should not be close.
Is EBITDA just gross profit?
No, and this is a frequent mix-up. Gross profit is revenue less cost of goods sold only. It sits high up the profit and loss account and says nothing about overheads such as salaries, rent, marketing or administration. EBITDA sits much lower down: it is gross profit less all those operating overheads, but before interest, tax, depreciation and amortisation. So EBITDA is always lower than gross profit for a business that carries any overhead at all. Confusing the two flatters your operating performance, because gross profit ignores the entire cost of running the office.
EBIT vs EBITDA vs PBT: the full ladder
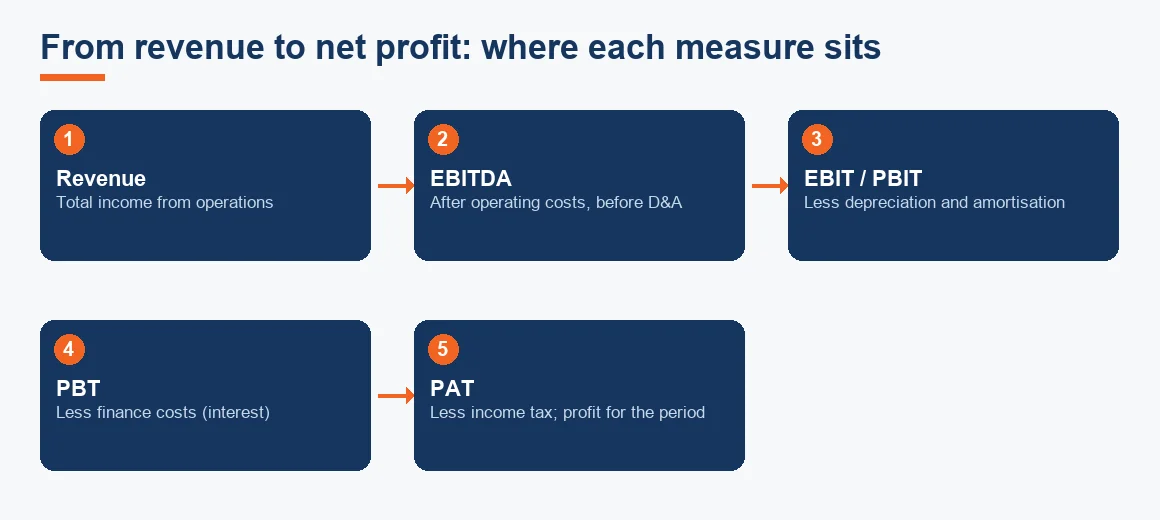
The clearest way to hold these measures in your head is to see them as rungs on one ladder from revenue down to what shareholders keep. Each rung strips out, or adds back, one specific type of cost. The table below sets out what each line includes and where it comes from.
| Measure | Full name | Charges deducted above it | In Schedule III accounts? |
|---|---|---|---|
| Gross Profit | Gross Profit | Cost of goods sold only | Derivable, not a named line |
| EBITDA | Earnings Before Interest, Tax, Depreciation & Amortisation | Operating expenses (not D&A) | No |
| EBIT / PBIT | Earnings / Profit Before Interest and Tax | Operating expenses plus depreciation & amortisation | No |
| PBT | Profit Before Tax | The above plus finance costs | Yes, a statutory line |
| PAT | Profit After Tax (Profit for the period) | The above plus income tax | Yes, a statutory line |
Read top to bottom, each rung deducts more cost, so the number gets smaller: gross profit is the largest and profit after tax is the smallest. The two statutory anchors are PBT and PAT, because those are the lines the Companies Act actually requires you to present. EBITDA and PBIT are management measures that you build from the audited numbers, which is why listed companies are expected to reconcile them back to profit before tax whenever they quote them.
Which comes first, EBIT or EBITDA?
Working down the ladder, EBITDA comes first and EBIT (PBIT) comes second, because you meet EBITDA higher up before depreciation is charged and EBIT lower down after it. Working up from the statutory PBT line, you reach EBIT first (add back interest) and then EBITDA (add back depreciation and amortisation). Both descriptions are correct; they just start from opposite ends. The order that matters in practice is the size order: EBITDA is the biggest of the three, PBT is the smallest, and EBIT sits between them.
A worked example: building EBITDA from a real profit and loss
Take a mid-sized trading company for the year ended 31 March 2026. The figures below are illustrative. Work from revenue down to profit after tax, then read the same statement backwards to confirm the add-backs. Tax is charged at an assumed 25 per cent under the current corporate regime; your effective rate will differ with cess and any surcharge.
| Line item | Amount (INR) | Running measure |
|---|---|---|
| Revenue from operations | 5,00,00,000 | |
| Less: operating expenses (excluding D&A) | 4,20,00,000 | |
| EBITDA | 80,00,000 | Before interest, tax, D&A |
| Less: depreciation and amortisation | 25,00,000 | |
| EBIT / PBIT | 55,00,000 | Operating profit |
| Less: finance costs (interest) | 15,00,000 | |
| PBT | 40,00,000 | Statutory line |
| Less: income tax at 25% | 10,00,000 | |
| PAT (profit for the period) | 30,00,000 | Statutory line |
Now read it in reverse to reconcile, which is the check a lender or analyst will run: PBT of 40,00,000 plus finance costs of 15,00,000 gives PBIT of 55,00,000; add depreciation and amortisation of 25,00,000 and you reach EBITDA of 80,00,000. The EBITDA margin here is 80,00,000 divided by 5,00,00,000, or 16 per cent. Whether that is good depends entirely on the sector, so compare it against this company's own trend across several quarters rather than against an unrelated industry.
Why lenders and buyers lean on EBITDA
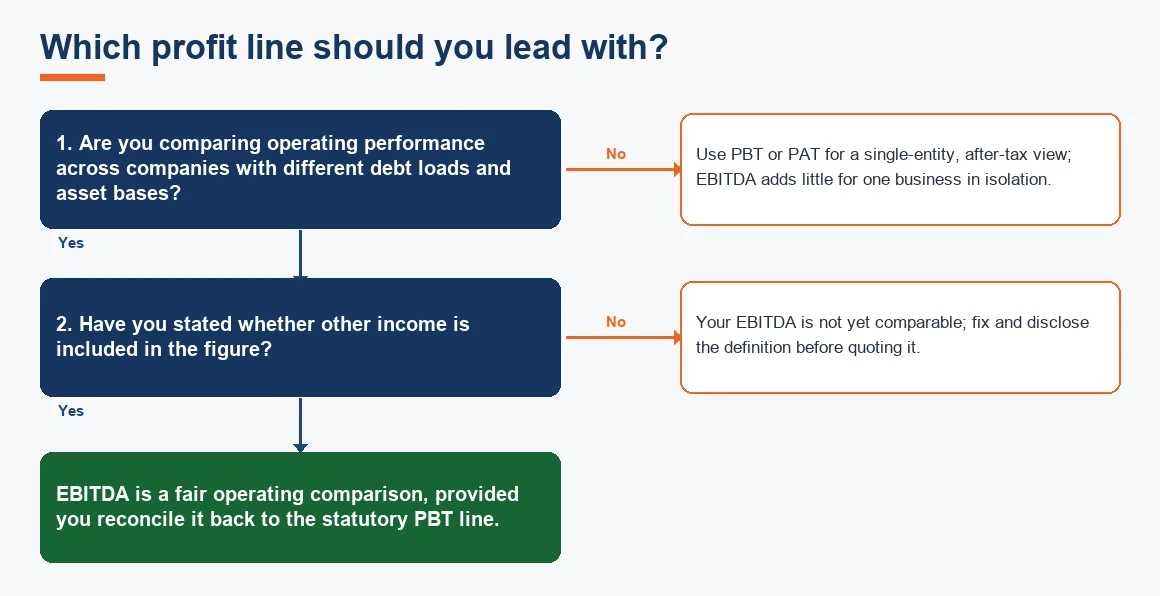
Net profit moves with things that say little about the underlying trade: the depreciation method chosen, the amount of debt taken on, one-off write-offs and tax positions. EBITDA neutralises those, which is why banks anchor covenants to it. Sanction letters commonly cap total debt to EBITDA at around three times and require debt service coverage above 1.25 times, and business valuations are frequently quoted as a multiple of EBITDA. That does not make EBITDA superior to net profit; it makes it a cleaner starting point for comparing two businesses before financing and asset policy get in the way. For your statutory tax and dividend decisions, PBT and PAT remain the numbers that count.
Getting to a clean EBITDA depends on the ledgers underneath being right. If depreciation has been mis-posted, invoices are missing or opening balances are wrong, every measure on the ladder is off. That is where disciplined adjusting entries before finalising accounts and a proper year-end closing checklist earn their keep, and why the closing entries at period end must tie back to the trial balance before any margin is quoted. If your books have fallen behind, backlog bookkeeping and catch-up comes first; if creditor and debtor ledgers are the weak point, accounts payable outsourcing and accounts receivable outsourcing keep them current through the year.
Where these measures live in your reporting
PBT and PAT belong in the audited profit and loss account and flow into your tax computation. EBITDA and PBIT belong in management reporting: they drive the operating story in your monthly review and in any lender or investor pack. The discipline is to derive the management measures from the same audited base every time, so the numbers reconcile when someone checks. Once the accounts are finalised, the recurring analysis of margins and trends is really a MIS reporting task, built on a properly closed set of financial statements. For the mechanics of turning a trial balance into a signed statement, see our guide to finalisation of accounts, and if you want to sense-check the depreciation figure that separates PBIT from EBITDA, our depreciation calculator applies the Schedule II rates.
Key terms
- EBITDA: earnings before interest, tax, depreciation and amortisation; an operating profit proxy, not a statutory line.
- Depreciation: the spreading of an asset's cost over its useful life; the non-cash charge that separates PBIT from EBITDA.
- Gross Profit: revenue less cost of goods sold only, before any operating overhead.
- Net Profit: profit after every expense including tax; the same as profit for the period.
- Profit & Loss Statement: the statement that carries revenue, expenses, finance costs, PBT and PAT under Schedule III.
Key takeaways
- PBIT and EBIT are the same figure; EBITDA is that figure plus depreciation and amortisation.
- PBIT is stated after depreciation; EBITDA is stated before it, so EBITDA is always the larger number.
- Only PBT and PAT are statutory lines under Schedule III; EBITDA and PBIT are management measures you reconcile back to PBT.
- EBITDA is not cash: read it with the cash flow statement and always state whether other income is included.
- Lenders use EBITDA to compare across borrowers; you still use PBT and PAT for tax and dividends.
The rules for what a set of Indian company accounts must contain are set by the Ministry of Corporate Affairs under Schedule III of the Companies Act, viewable at mca.gov.in, and the expectation that non-GAAP measures such as EBITDA are reconciled to audited figures follows guidance from the ICAI. Current corporate tax rates, which determine the step from PBT to PAT, are published by the Income Tax Department.
Decision guide