

In this guide
Hospital department profitability is measured by building a department-wise profit and loss account that splits revenue and cost across each clinical and support unit, so the management can see which department actually earns a surplus and which one runs at a loss once shared overhead is loaded in. A single hospital-level profit figure hides this completely: a busy outpatient department can look healthy while the casualty and general ward drag the whole institution down. This explainer sets out how the split works, what drivers to use, and a worked example with the arithmetic shown. For a full commercial engagement, our Healthcare Accounting Services team handles the setup end to end.
What is a department-wise P&L for a hospital?
A departmental trading and profit and loss account reports the result of each department in its own column, with a general column holding costs that cannot fairly be traced to any single unit. The consolidated total of all columns must still equal the main Profit & Loss Statement, so nothing is created or lost in the split. Typical hospital departments are OPD (outpatient), IPD (inpatient wards), ICU and critical care, operation theatre, radiology and imaging, pathology laboratory, pharmacy and dietary or canteen services.
The point of the exercise is decision-making, not statutory filing. Once you can see that radiology contributes a 40 percent margin while casualty barely breaks even, you can price procedures better, negotiate equipment contracts with real numbers, and decide where to add capacity. This sits alongside broader management reporting; if you want the wider dashboard view, our MIS reporting work builds on the same departmental base.
Which are the most profitable hospital departments?
Across most Indian multi-speciality hospitals, the strongest margins come from diagnostics and planned surgical work, because the equipment and theatre are heavily used and each procedure carries a high value relative to its marginal cost. Radiology (CT, MRI, ultrasound), the pathology laboratory, and IPD surgical specialities such as cardiology, orthopaedics and oncology usually lead. Cardiac catheterisation and dialysis units also run well when volumes are steady.
Departments that commonly run thin are the general OPD, casualty and emergency, and the general medicine ward, because staffing is fixed but revenue per patient is low. This is not a reason to close them: OPD and casualty feed patients into the profitable inpatient and diagnostic departments. The department-wise view simply lets you see the true contribution of each, rather than assuming a busy waiting room means a profitable clinic.
What is a hospital's biggest expense?
For most hospitals, salaries and professional fees together are the single largest cost, typically the biggest line on the profit and loss account. This covers nursing staff, resident doctors, technicians and support staff, plus fees paid to visiting and consultant doctors. The second heavy block is consumables and pharmacy purchases (drugs, implants, surgical disposables), followed by equipment depreciation, power, rent and biomedical maintenance.
How you treat consultant payments matters for both the P&L and for tax. Payments to visiting or consultant doctors are professional fees under section 194J and attract TDS at 10 percent once the annual payment crosses the prescribed threshold, while salaried doctors fall under section 192 at slab rates. Misclassifying a retainer doctor as an employee, or the reverse, triggers demand and interest, so keep the engagement contract on every doctor's file. The mechanics are covered in detail in our note on TDS on doctor professional fees, and doctors billing independently should also read section 44ADA presumptive taxation for doctors.
How to build a department-wise P&L, step by step
The build follows a fixed sequence. Do it once carefully and the monthly report becomes almost automatic.
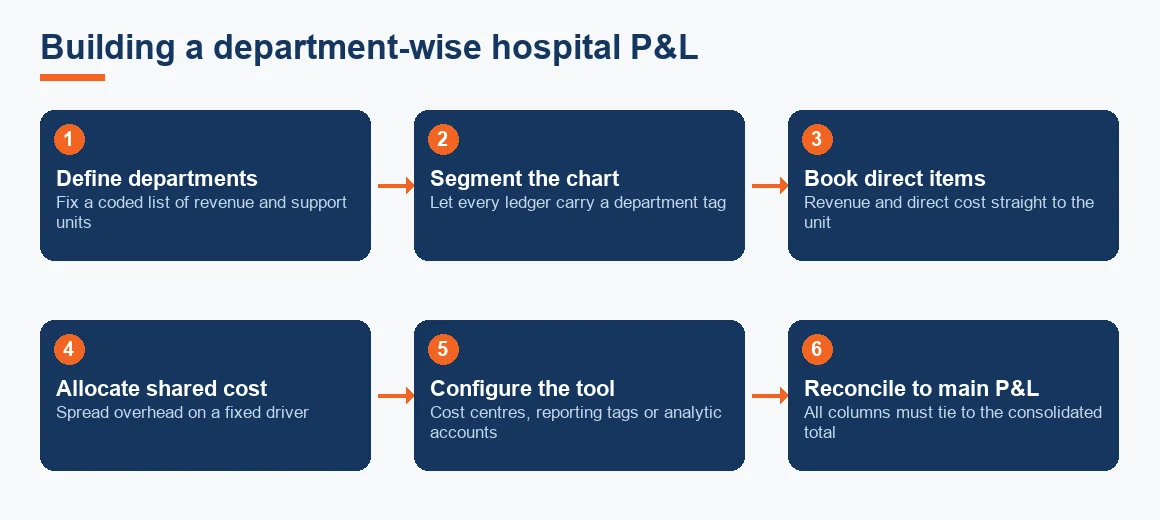
- Define the department list. Fix a stable set of departments and give each a code. Keep support units (housekeeping, administration, biomedical) separate from revenue units so you can allocate them later.
- Map the chart of accounts. Build a segmented chart of accounts so every revenue and direct-cost ledger can carry a department tag at voucher entry.
- Book direct revenue and direct cost. Consultation fees, procedure charges, laboratory tests and pharmacy sales go straight to their department. Nursing salary for a ward, and consumables issued to a theatre, are direct costs of that unit.
- Choose allocation drivers for shared cost. Rent, power, housekeeping, administration and biomedical maintenance are spread across departments on a measurable basis (covered in the next section).
- Set the tool up. Tally Prime uses cost centres and cost categories; Zoho Books uses reporting tags; Odoo uses analytic accounts with analytic distribution. All three produce a department column report without a separate ledger set.
- Reconcile to the main P&L. The sum of all department columns plus the general column must equal the consolidated profit and loss. If it does not, a voucher is untagged.
How are shared hospital costs allocated across departments?
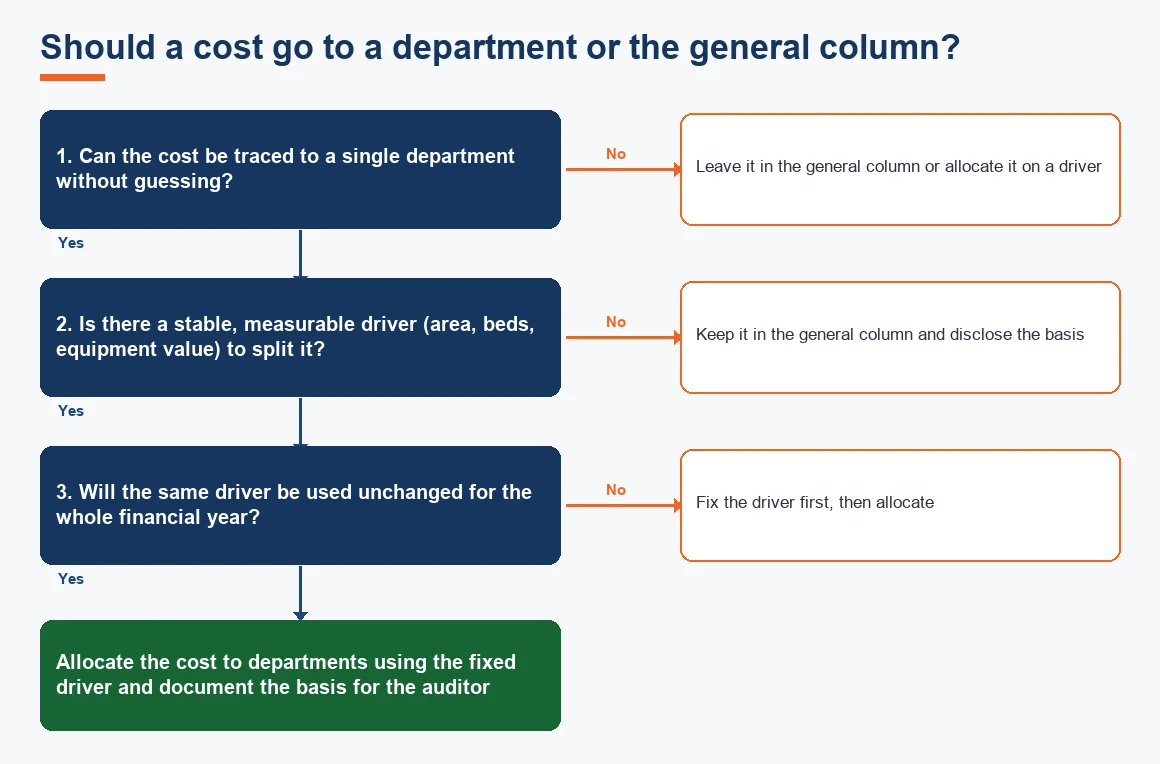
Shared costs are allocated on a measurable driver chosen to reflect how the department actually consumes the resource. Fix the driver at the start of the financial year and keep it unchanged, so month-on-month comparison stays valid and auditors can test allocation consistency. Document the basis in a short note attached to the accounts.
| Shared cost | Allocation driver | Why it fits |
|---|---|---|
| Rent and building depreciation | Floor area (sq ft) occupied | Space is the resource being consumed |
| Electricity and power | Floor area, weighted for heavy equipment | Radiology and ICU draw far more load |
| Housekeeping and laundry | Floor area or bed count | Cleaning scales with space and beds |
| Biomedical maintenance | Equipment value in the department | Costly machines need more upkeep |
| Administration and IT | Departmental revenue or headcount | Reasonable proxy for effort used |
What is a good profit margin for a hospital?
A healthy net margin for an established multi-speciality hospital in India generally sits in the region of 10 to 20 percent, while EBITDA margins run higher because depreciation on buildings and equipment is heavy. A 20 percent net margin is a strong result for a mature hospital, though newer units carrying fresh borrowing and depreciation often report much less in early years and that is normal. Rather than chase a single headline figure, watch the EBITDA and net profit trend at department level, because the blended hospital margin hides the departments that need attention.
Turnover, in the sense of bed turnover rate (patients per bed per period), is a related operational measure: a higher bed turnover with stable margins usually signals efficient use of ward capacity, but it should be read together with average length of stay so you do not mistake premature discharge for efficiency.
Worked example: a three-department P&L for one month
Assume a hospital reports one month across three units. Direct revenue and direct cost are booked to each department. Shared overhead of 12,00,000 rupees is split by floor area: Radiology 20 percent, IPD Surgery 50 percent, OPD 30 percent. All figures are indicative and in rupees.
| Line | Radiology | IPD Surgery | OPD | Total |
|---|---|---|---|---|
| Direct revenue | 40,00,000 | 90,00,000 | 25,00,000 | 1,55,00,000 |
| Direct cost (staff, consumables) | 18,00,000 | 52,00,000 | 19,00,000 | 89,00,000 |
| Contribution | 22,00,000 | 38,00,000 | 6,00,000 | 66,00,000 |
| Allocated overhead | 2,40,000 | 6,00,000 | 3,60,000 | 12,00,000 |
| Net result | 19,60,000 | 32,00,000 | 2,40,000 | 54,00,000 |
| Net margin | 49% | 36% | 10% | 35% |
The blended hospital margin is 35 percent, but the split shows OPD earns only a 10 percent net margin after overhead, while radiology and surgery carry the institution. If management had raised the overhead allocation to OPD, or loaded a fixed doctor retainer there, OPD could easily flip to a loss. That is exactly the signal a department-wise P&L is built to surface.
GST and the exempt-output complication
Healthcare services provided by a clinical establishment, an authorised medical practitioner or paramedics are exempt from GST under Notification 12/2017-Central Tax (Rate). Pharmacy sales to outpatients, canteen sales, cosmetic procedures and equipment rental remain taxable, so a hospital typically has a mix of exempt and taxable supplies. Because most output is exempt, input tax credit is restricted, and the unclaimed GST on purchases becomes part of departmental cost rather than a recoverable asset. This is why the pharmacy and cosmetic departments behave differently in the P&L from the clinical wards, and it is worth reading our fuller note on which healthcare services are GST exempt versus taxable. The receivables side, especially insurer and TPA settlements, has its own reconciliation discipline covered in how hospitals should reconcile TPA and insurance receivables.
Choosing the right tool as departments grow
All three common Indian tools produce a department column, but they scale differently. Tally Prime works well up to roughly eight departments through cost centres and cost categories; beyond that, tagging every voucher becomes error-prone. Zoho Books reporting tags suit a mid-sized hospital, and Odoo analytic accounts with analytic distribution scale best for a large multi-speciality institution where one voucher must split across several units. Whichever you choose, the discipline of variance analysis against the prior month and the budget is what turns the report into a decision, and a contribution margin dashboard makes the pattern visible to non-finance managers. You can size the equipment depreciation load with our depreciation calculator before finalising the overhead pool.
The same departmental thinking runs across other verticals we support: project-based work in IT and software company accounting and SaaS accounting, and unit economics for early-stage founders in startup accounting. If you only need the underlying books kept clean first, our general accounting services cover the bookkeeping layer this report sits on.
Key terms
- Operational Cost Centers: the ledger tags that route each voucher to a department in Tally.
- Segmented Chart of Accounts: a chart structured so accounts carry a department dimension.
- Contribution Margin Dashboard: a view of revenue minus direct variable cost per unit.
- Variance Analysis: comparing actuals against budget or prior period to explain movement.
- TPA Receivables: amounts due from insurers and third-party administrators for cashless treatment.
Key takeaways
- A department-wise P&L splits revenue and cost by unit and must reconcile back to the main profit and loss account.
- Book direct costs to their department and allocate shared cost on a fixed, documented driver such as floor area, bed count or equipment value.
- Radiology, laboratory and planned surgical departments usually lead on margin; OPD and casualty run thin but feed the profitable units.
- Salaries and consultant fees are the biggest expense; classify consultant TDS under 194J at 10 percent, not 192, unless the doctor is a genuine employee.
- Healthcare output is GST exempt under Notification 12/2017, so restricted input tax credit becomes departmental cost.
Authoritative references: the GST exemption for clinical services sits in Notification 12/2017-Central Tax (Rate), available on the CBIC GST portal and the GST portal. TDS provisions under sections 194J and 192 are set out by the Income Tax Department, and accounting standards guidance is published by the ICAI.
Decision guide